Download
1 / 44
450 likes | 687 Views
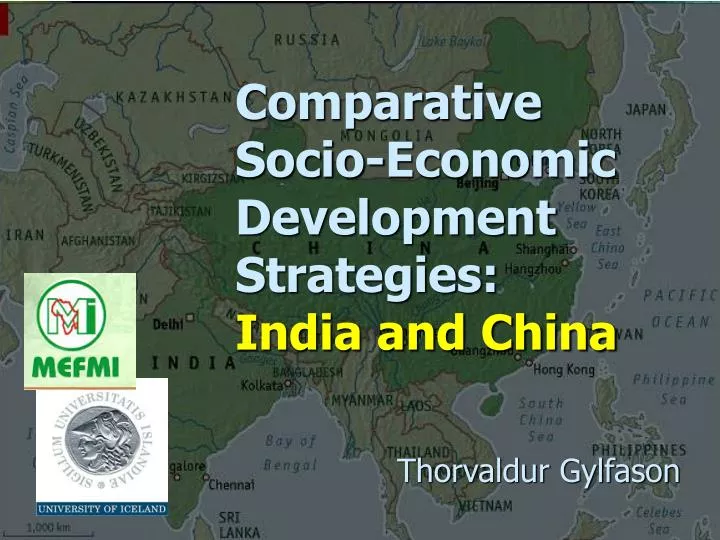
Comparative Socio-Economic Development Strategies: India and China. Thorvaldur Gylfason. What’s the story?. Two giants. Compare the development strategies and trajectories of the two economic giants of Asia One obvious difference India is a democracy China, though, is not

E N D
Comparative Socio-Economic Development Strategies:India and China Thorvaldur Gylfason
What’s the story? Two giants • Compare the development strategies and trajectories of the two economic giants of Asia • One obvious difference • India is a democracy • China, though, is not • Many other differences, and similarities that include • Low foreign debts • Long coastlines • Large overseas communities
India and China: GDP per capita 1820-1950 (constant 1990 US dollars) China was richer than India 200 years ago, but India did better than China thereafter
India and China: GDP per capita 1820-1950 (constant 1990 US dollars) Since 1950, however, China has grown more rapidly than India, albeit less evenly Why?
India and China: GDP per capita 1975-2003 (ppp, 2000 international dollars) China 7.7% India 3.2% Africa -0.5%
India and China: GDP per capita 1960-2003 (2000 international dollars) China 5.7% Africa 0.5% India 2.5%
India and China: Life expectancy at birth 1960-2004 Persistent rise in life expectancy as well as in other human development indicators in both China and India since 1960
What it takes to grow • Saving and investment Physical capital • Education, health care Human capital • Macroeconomic stability Financial capital • Exports and imports Foreign capital • Democracy Social capital • Diversification Away from natural capital Undisputed Controversial
Three main sources of economic growth + + + denotes a positive effect in the direction shown +
Three further sources of economic growth Let’s now look at these factors one by one + Stability + + + + + Diversification Democracy Economic vs. political diversification
Investment 1960-2004 In China, more investment and more rapid economic growth, but … % of GDP
Investment 1960-2004 In China, it takes almost twice as much investment to grow roughly twice as fast as India Chinese banks have more nonperforming loans than Indian banks % of GDP
Investment 1960-2004 In China, it takes 41 days to obtain the licenses necessary to start a business In India, it takes 89 days % of GDP
Gross foreign direct investment 1960-2004 China attracts far more foreign capital than India, especially through joint ventures % of GDP
Gross foreign direct investment 1960-2004 China appears to have less endemic corruption: 27% of managers in China view corruption as a major constraint compared with 37% in India % of GDP
Gross foreign direct investment 1960-2004 China appears to have less endemic corruption: Transparency International in Berlin gives China 3.4 for corruption and India 2.8 on a scale from 1 to 10 % of GDP
Inflation and financial depth 1960-2004 China’s inflation 1961-2003 was 3.2% per year on average compared with India’s 7.6% China’s liquidity grew faster Liquidity lubricates the wheels of growth % of GDP % of GDP
Inflation and financial depth 1960-2004 China’s market capitalization of listed companies increased from scratch in 1991 to nearly 50% of GDP in 2003 India’s figure is also a bit less than 50% % of GDP % of GDP
Exports 1960-2004 China’s exports of goods and services have outpaced those from India In China, taxes on trade are now 9% compared with 16% in India % of GDP
Adult female literacy 1960-2004 China has taught more females than India how to read and write The youth female literacy rate in China is 99% compared with 65% in India %
Adult female literacy 1960-2004 China sends almost 70% of her youngsters to secondary school compared with 50% in India “An educated child does not want to plant rice” %
Agriculture 1960-2004 China has done more than India to transfer labor from the land Where have all the workers gone? % of GDP
Manufacturing 1960-2004 Rural workers in China have flocked into manufacturing In India, the services sector has expanded rapidly Hardware vs. software % of GDP
The results so far • China • Saves and invests more than India • Attracts more foreign capital • Has less inflation • Exports more goods and services • Teaches more females how to read • Transfers her labor more rapidly out of farming into manufacturing and services • Small wonder, then, that China grows more rapidly than India • Even without democracy!
China started earlier • Common legacy of foreign influence or domination followed by communism or socialism • Market-friendly reforms started earlier in China than in India • 1978 in China • 1991 in India • So, China has been reforming her economy twice as long as India • … and more rapidly and radically
Next question The role of democracy • Again, one glaring difference • India is a democracy • China is not • Does democracy impede economic growth? • Is this, perhaps, why India has grown less rapidly than China since 1950?
Two theories • Democracy is good for growth, and so are investment, education, etc. • Reason: democracy fosters efficiency by facilitating change of government, and efficiency is good for growth • Democracy hurts growth, or worse • Reason: democracy plays into the hands of pressure groups that tend to abuse their power at public expense
Growth and political liberties 1965-98 Democracy is good for growth: No visible sign that democracy stands in the way of economic growth Brazil Botswana China Korea India Venezuela Central African Republic Niger r = -0.62 85 countries
Growth and political liberties 1965-98 Political liberty is good for growth because oppression breeds inefficiency, and so does corruption Brazil Botswana China Korea India Venezuela Central African Republic Niger r = -0.62
Must look elsewhere for an explanation Growth and democracy 1960-2000 Equatorial Guinea Singapore Malaysia Democracy and growth seem to go together r = 0.48 144 countries
Must look elsewhere for an explanation Education and democracy 1960-2000 Equatorial Guinea r = 0.62 Singapore Malaysia Democracy and education go hand in hand 126 countries
Democracy 1946-2000 1946: 20 out of 70 2000: 90 out of 170 Democracy Oligocracy Number of countries Autocracy
Other ways to build up social capital • Measures to combat corruption • Corruption perceptions index from Transparency International • Measures to enhance equality • Gini index • What do the data say?
Growth and corruption 1965-1998 Small difference Honesty is good for growth because corruption creates inefficiency China India r = 0.40 55 countries
Growth and inequality 1965-1998 Big difference Equality is good for growth: No visible sign that equality stands in the way of economic growth China India r = -0.50 75 countries
Growth and inequality 1965-1998 Big difference • Gini-coefficients: • India 33 • China 45 China India r = -0.50 75 countries
One more thing: Fertility • China adopted a one-child policy in 1980 • Relaxed it subsequently to allow two children – if the first was a girl • 300 million fewer Chinese today than otherwise would have been the case • This should be good for growth • India did no such thing • India’s population is forecast to overtake China’s by 2025
Births per woman 1960-2004 Less rapid population growth means fewer mouths to feed and fewer minds to educate, allowing better care for each child, and hence more rapid growth Number of births
Child mortality 1960-2004 More and better health care and education have helped reduce child mortality in China and in India, and across the world Let’s take a look Per 1,000 live births
Fertility and growth 1960-2004 Fewer births go along with higher growth Fewer births increase and improve human capital Rank correlation between fertility and education is -0,90 China India r = -0.78 87 countries
Even so, India has a more equal distribution of income, with a Gini index of 33 compared with 45 in China Equality is good for growth Poverty 1999 % of population
Sir Arthur Lewis got it right Since the second world war it has become quite clear that rapid economic growth is available to those countries with adequate natural resources which make the effort to achieve it W. Arthur Lewis (Accra, 1968)
Conclusion: It can be done The same applies to Africa • China and India are like other countries, not special cases • What works for the rest of the world also works for them • Economic policies and institutions that spur investment, openness, education, health care, diversification, democracy, and family planning are good for growth
Conclusion: It can be done These slides – and more! – can be viewed on my website: www.hi.is/~gylfason To grow or not to grow is in large measure a matter of choice Many of the constraints on growth are man-made, and can be removed The End