Download

1 / 55
550 likes | 655 Views
Don’t Dread It – Collect It. Think Tank – March 20, 2013. Rex Wilcox, MA CWP Wellness Manager at Via Christi Health. Data. Defined Values of quantitative or qualitative variables Typically the result of measurements Can be visualized using graphs or images Raw data

E N D
Don’t Dread It – Collect It Think Tank – March 20, 2013
Rex Wilcox, MA CWP • Wellness Manager at Via Christi Health
Data • Defined • Values of quantitative or qualitative variables • Typically the result of measurements • Can be visualized using graphs or images • Raw data • A collection of numbers • Field data • Raw data collected in an uncontrolled environment
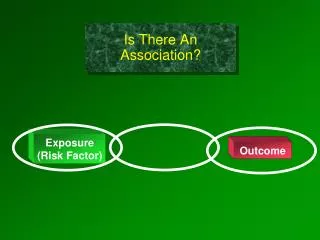
Causation vs. Correlation • Causation • Relationship is direct • A causes B • Correlation • B is not a direct result of A • When A occurs B is at an increased likelihood of occurring
Data Collection • 3rd of WELCOA’s 7 benchmarks • “Collecting Data to Drive Health Efforts” • Key component of any comprehensive worksite wellness initiative or population health management initiative • Included in Foundation of WorkWell KS curriculum
Demographics • Employee demographics • Age • Average age • Largest age “bucket” • Gender • Full-time vs. part-time • Benefit eligible vs. enrolled
Personal Health Assessment • Aggregate PHA Data • Behavioral risks • Physical activity • Nutrition • Diagnosed/chronic conditions • Perceived health • Mental health (stress)
Biometric Data • Lab values • Lipids (cholesterol and triglycerides) • Glucose • HbA1c • Cotinine (nicotine metabolite) • Anthropometrics (body measurements) • Height • Weight • Hip/waist
Biometric Data • Quality depends on how data is gathered • Self-reported vs. blood draw (venous or finger stick) • Consistency from year-to-year so data is comparable
PHA vs. Biometrics • PHA • Data self-reported • Provides potential future risk • Biometrics • Provides “window” to existing physiological state as a result of past behaviors • Combined they provide accurate picture of those with current risk and those who will be at risk tomorrow (if nothing changes)
Medical & Pharmacy • Claims • Medical • Highest cost conditions • Most prevalent conditions • Preventive care utilization • ER utilization • Pharmaceutical • Highest cost meds • Most utilized meds • Generic med utilization rate
Needs & Interests • Employee needs and interests • PHA and claims don’t tell the whole story • People more likely to take action in area of interest • Employer needs • Sometimes referred to as a gap analysis • What areas require improvement
Culture Data • Culture audit • What are the common practices? • What behavior is rewarded? • What policies support healthy lifestyles? • Are they enforced
Environment Data • Environmental audit • What aspects of built environment support healthy living? • What aspects inhibit healthy living? • Consider: • Stairwells & walking paths/trails • Break rooms • Shower facilities • Exercise equipment or facility • Food prices
Process Data • Participation • Completion of PHA and/or biometric screening • % of eligible population completing PHA • Wellness challenge participation • Weekly participation • Who is participating? • # of those registered at start vs. # still participating at conclusion
Process Data • Utilization • Email newsletter • Open rate • Which articles/links were clicked on most • Wellness portal (or intranet page) • Most commonly visited pages • Time spent on site or on specific page • Fitness room • Number using per day • Most popular time
Process Data • Vending &/or Cafeteria • Purchase rate of health vs. unhealthy options • Most frequently used machine(s) • Activity • Number of people walking during breaks • Number of people cycling to work
Employee Satisfaction • Is the process easy and understandable? • Is information easy to find? • Do the programs address their individual needs? • How has the individual benefited?
Outcomes Data • Measurement of change • As a result of intervention • Program, challenge or promotion • Pre/post survey • Examples: • Step/activity challenge • Fruit/veggie challenge
Population Data • Gallup-Healthways Wellbeing Index • Began in January of 2008 • 1,000 phone interviews 7 days per week since • Provide annual state and congressional district wellbeing rankings
Population Data • KS MSA Rankings • Data Collected1/2/12-12/30/12 • (MSA=Metropolitan Statistical Area)
Population Data • Behavioral Risk Factor Surveillance System (BRFSS) • Data gathered and reported by CDC • Most recent available is 2010
Don’t Recreate the Wheel; • Existing Measurement Tools
Comprehensive Assessments • HERO Scorecard (http://www.the-hero.org) • Provides annual benchmark report (collaboration with Mercer) • Compare your company’s scores against the benchmark • Compare your scores from year-to-year
Comprehensive Assessments • WELCOA Checklist (http://www.welcoa.org/wwpchecklist/) • Overall assessment of worksite wellness initiative • Provides ability to identify areas to target for improvement • Can compare year-to-year
Comprehensive Assessments • CDC’s Healthy Worksite Scorecard • Assessment of entire worksite wellness initiative • Provides benchmark scoring and report for comparison
Needs & Interest Surveys • WELCOA • Employee needs assessment • Wisconsin Dept. of Health Services(Part of Worksite Wellness Resource Kit) • Corporate needs assessment
Culture and Environment Assessments • WELCOA • Culture survey (for employees) • Checklist of Health Promotion Environments at Worksites (CHEW) • Observational assessment • Designing Healthy Environments at Work (DHEW)
Combine Data • Link PHA and Claims • Make a linkage between: • Behaviors and cost • Biometrics and cost • Risk level and cost • Link PHA or Claims with Absence Records • Are those with higher risks absent more • Are there specific risks strongly correlated to higher absence?
Establish a Baseline • What do you plan to measure against? • Where is your organization today? • Lifestyle behaviors • Health plan costs or utilization • Absence rates/frequency
Connect or Compare • What inconsistencies exist? • Example: • In needs/interest survey 90% reported having a PCP • Yet in claims data only 40% have been seen for preventive care visit in past 12 months • Comparison • Are there striking differences among segments of your organization?
Inform Decisions • Appropriately target employees • Provide an incentive that will adequately drive participation • Implement programs that meet needs and risks • Identify over/under utilization • Most commonly in benefit design and individual self-care (medical consumerism)