Download
1 / 13
140 likes | 153 Views
Designing Experiments. Section 5.2.1. Starter 5.2.1.

E N D
Designing Experiments Section 5.2.1
Starter 5.2.1 • In late 1995, a Gallup survey reported that Americans approved sending troops to Bosnia by 46 to 40 percent. The poll did not mention that 20,000 U.S. troops were committed to go. A CBS News poll mentioned the 20,000 number and got the opposite outcome – a 58 to 33 percent disapproval rate. Briefly explain why the mention of the number of troops would cause such a big difference in the poll results. Write the name of the kind of bias that is at work here. • A church group interested in promoting volunteerism in a community chooses an SRS of 200 community addresses and sends members to visit these addresses during weekday working hours and inquire about the residents’ attitude toward volunteer work. Sixty percent of all respondents say that they would be willing to donate at least an hour a week to some volunteer organization. Bias is present in this sample design. Identify the type of bias involved and state whether you think the sample proportion obtained is higher or lower than the true population proportion.
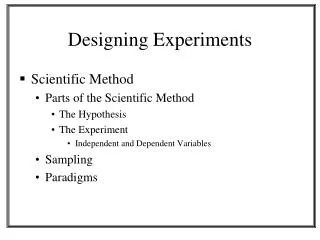
Objectives • Describe the difference between an observational study and an experiment. • Draw a schematic diagram of a completely randomized experiment that allows comparison between a treatment group and a control group. • State the three principles of experimental design • Describe what is meant by “statistically significant” • Describe what is meant by a “double blind” experiment
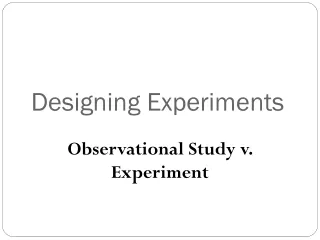
Study vs. Experiment • An observational study surveys individuals to measure variables of interest. No attempt is made to influence the response. • There is only one variable involved • An experimentimposes a treatment on individuals and observes the response. • The treatment imposed is the explanatory variable • The response observed is the response variable
Three Principles of Experimental Design • Comparison • The possible effects of lurking variables are controlled by comparing two or more treatments, where the only difference among groups is the treatment received. • In many cases, one treatment will be a placebo. • Randomization • Some valid scheme of taking a probability sample is used to choose which individuals get which treatment. • No person (experimenter or subject) gets to choose a treatment. • Replication • Choose a large enough sample such that simple random chance does not significantly affect the outcome.
Simple Experiment Design Group 1 Impose Treatment Random Allocation Compare Results Group 2 Give Placebo
Example • You want to test a new drug to see if it provides pain relief to migraine sufferers. • Draw a schematic diagram of an experimental design that could be used on a group of 30 subjects.
Experiment to test a new drug using 30 chronic migraine sufferers as subjects Treatment Group Chosen 15 Give drug 30 Subjects: Choose SRS of 15 Compare Results Placebo Group Other 15 Give placebo
Blindness in Experiments • We have already seen the placebo effect, in which subjects respond to any treatment. • Experimenters as well can be influenced by the knowledge that a treatment was applied to a subject. • To avoid these problems, design your experiment double-blind (where possible). • This means that neither the subject nor the person administering the treatment knows whether the subject is receiving the active treatment or a placebo.
Statistical Significance • Suppose 40 Northgate students and 40 Las Lomas students take the AP Stat Exam next May. • Suppose further that 20 of the Northgate students score perfect 5’s, and that 18 of the Las Lomas students also score 5’s. • Is this persuasive evidence that the Northgate program is superior to the Las Lomas program? • Probably not: This small difference could easily be due to nothing more than random chance.
Statistical Significance • Now suppose that of the 40 who took the test, 20 Northgate students scored 5’s but only 6 Las Lomas students scored 5’s. • Is this persuasive evidence that the Northgate program is superior to the Las Lomas program? • Probably so: This difference is too large to be due to nothing more than random chance. Something else must be going on. • We call results like these statistically significant • A simple definition of statistically significant is: “Unlikely to Happen by Chance”
Objectives • Describe the difference between an observational study and an experiment. • Draw a schematic diagram of a completely randomized experiment that allows comparison between a treatment group and a control group. • State the three principles of experimental design • Describe what is meant by “statistically significant” • Describe what is meant by a “double blind” experiment
Homework • Read pages 265 – 273 • Do problems 27, 28, 29, 31, 35, 39