Download
1 / 29
290 likes | 370 Views
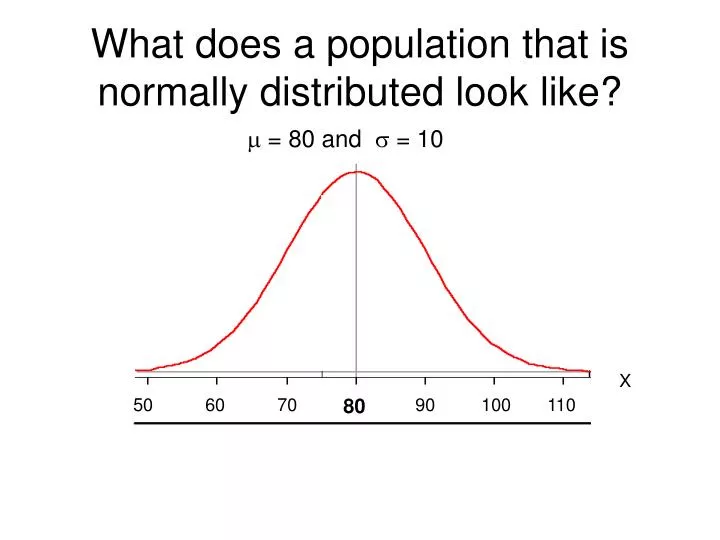
What does a population that is normally distributed look like?. = 80 and = 10. X. 50. 60. 70. 80. 90. 100. 110. Empirical Rule. 68%. 95%. 99.7%. 68-95-99.7% RULE. Empirical Rule —restated.

E N D
What does a population that is normally distributed look like? = 80 and = 10 X 50 60 70 80 90 100 110
Empirical Rule 68% 95% 99.7% 68-95-99.7% RULE
EmpiricalRule—restated 68% of the data values fall within 1standard deviation of the mean in either direction 95% of the data values fall within 2standard deviation of the mean in either direction 99.7% of the data values fall within 3standard deviation of the mean in either direction Remember values in a data set must appear to be a normal bell-shaped histogram, dotplot, or stemplot to use the Empirical Rule!
Empirical Rule 34% 34% 68% 47.5% 47.5% 95% 49.85% 49.85% 99.7%
Average American adult male height is 69 inches (5’ 9”) tall with a standard deviation of 2.5 inches.
Empirical Rule-- Let H~N(69, 2.5) What is the likelihood that a randomly selected adult male would have a height less than 69 inches? Answer: P(h < 69) = .50 P represents Probability h represents one adult male height
Using the Empirical Rule Let H~N(69, 2.5) What is the likelihood that a randomly selected adult male will have a height between 64 and 74 inches? P(64 < h < 74) = .95
Using Empirical Rule-- Let H~N(69, 2.5) What is the likelihood that a randomly selected adult male would have a height of less than 66.5 inches? P(h < 66.5) = 1 – (.50 + .34) = .16 OR .50 - .34 = .16
Using Empirical Rule--Let H~N(69, 2.5) What is the likelihood that a randomly selected adult male would have a height of greater than 74 inches? P(h > 74) = 1 – P(h 74) = 1 – (.50 + .47.5) = 1 - .975 = .025
Using Empirical Rule--Let H~N(69, 2.5) What is the probability that a randomly selected adult male would have a height between 64 and 76.5 inches? P(64 < h < 76.5) = .475 + .4985 = .9735
Z-Scores are standardized standard deviation measurements of how far from the center (mean) a data value falls. Ex: A man who stands 71.5 inches tall is 1standardized standard deviation from the mean. Ex: A man who stands 64 inches tall is -2standardized standard deviations from the mean.
Standardized Z-Score To get a Z-score, you need to have 3 things • Observed actual data value of random variable x • Population mean, also known as expected outcome/value/center • Population standard deviation, Then follow the formula.
Empirical Rule & Z-Score About 68% of data values in a normally distributed data set have z-scores between –1 and 1; approximately 95% of the values have z-scores between –2 and 2; and about 99.7% of the values have z-scores between –3 and 3.
Z-Score &Let H ~ N(69, 2.5) What would be the standardized score for an adult male who stood 71.5 inches? H ~ N(69, 2.5) Z ~ N(0, 1)
Z-Score &Let H ~ N(69, 2.5) What would be the standardized score for an adult male who stood 65.25 inches? h = 65.25 as z = -1.5
Comparing Z-Scores Suppose Bubba’s score on exam A was 65, where Exam A ~ N(50, 10). And, Bubbette score was an 88 on exam B, where Exam B ~ N(74, 12). Who outscored who? Use Z-score to compare. Bubba z = (65-50)/10 = 1.500 Bubbette z = (88-74)/12 = 1.167
Comparing Z-Scores Heights for traditional college-age students in the US have means and standard deviations of approximately 70 inches and 3 inches for males and 165.1 cm and 6.35 cm for females. If a male college student were 68 inches tall and a female college student was 160 cm tall, who is relatively shorter in their respected gender groups? Male z = (68 – 70)/3 = -.667 Female z = (160 – 165.1)/6.35 = -.803
Reading a Z Table P(z < -1.91) = ? .0281 P(z -1.74) = ? .0409
Reading a Z Table P(z < 1.81) = ? .9649 P(z 1.63) = ? .9484
Using Z-Table Find the two tables representing z-scores from –3.49 to +3.49. Notice which direction the area under the curve is shaded (Table reads for ONLY shaded area to the left). The assigned probabilities represents the area shaded under the curve from the z-score and to the far left of the z-score.
Find P(z < 1.85) From Table: .9678 -3 -2 -1 0 +1 +2 +3 1.85
Find P(z > 1.85) From Table: = 1 – P(z < 1.85) = 1 - .9678 = .0322 .9678 -3 -2 -1 0 +1 +2 +3 1.85
Find P( -.79 < z < 1.85) = P(z < 1.85) - P(z < -.79) = .9678 - .2148 = .7530 -1 +1 +2 -3 -2 0 +3 -.79 1.85
What if I know the probability that an event will happen, how do I find the corresponding z-score? • Use the Z Tables and work backwards. Find the probability value in the table and trace back to find the corresponding z-score. • 2) Use the InvNorm command on your TI by entering in the probability value (representing the area shaded to the left of the desired z-score), then 0 (for population mean), and 1 (for population standard deviation).
P(Z < z*) = .8289What is the value of z*? P(Z < z*) = .8289 has the value of z* = .95 Therefore, P(Z < .95) = .8289.
P(Z < z*) = .80What is the value of z*? P(Z < .84) = .7995 and P(Z < .85) = .8023, therefore P(Z < z*) = .80 has the value of z* approximately .84??
P(Z < z*) = .77What is the value of z*? What is the approximate value of z*?