Download
1 / 1
10 likes | 79 Views
Jul. Dec. Apr. Annual C Budgets. Introduction. Daily Response to Temperature. Comparison of Carbon Fluxes Over Three Boreal Black Spruce Forests in Canada.

E N D
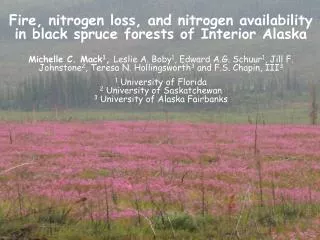
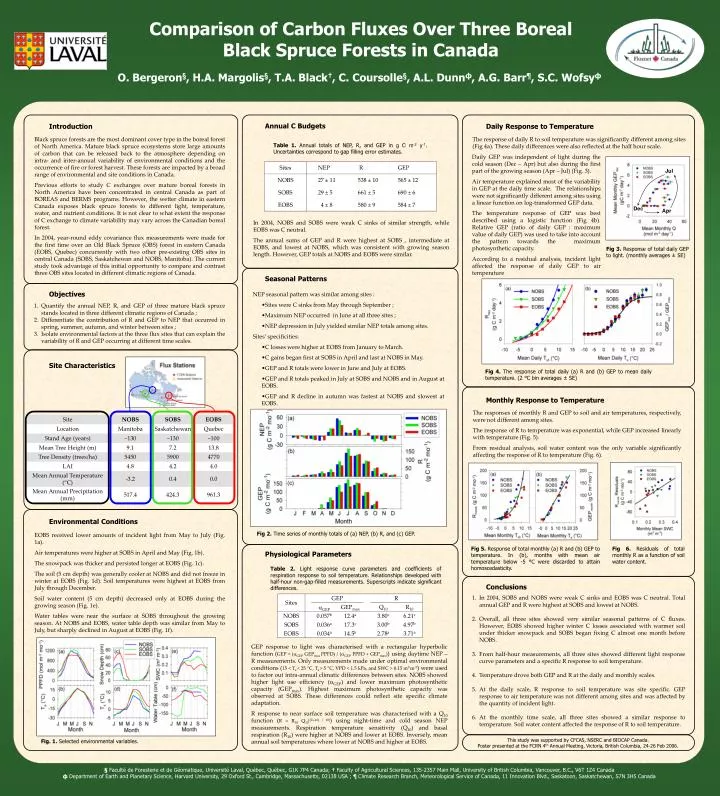
Jul Dec Apr Annual C Budgets Introduction Daily Response to Temperature Comparison of Carbon Fluxes Over Three Boreal Black Spruce Forests in Canada Black spruce forests are the most dominant cover type in the boreal forest of North America. Mature black spruce ecosystems store large amounts of carbon that can be released back to the atmosphere depending on intra- and inter-annual variability of environmental conditions and the occurrence of fire or forest harvest. These forests are impacted by a broad range of environmental and site conditions in Canada. Previous efforts to study C exchanges over mature boreal forests in North America have been concentrated in central Canada as part of BOREAS and BERMS programs. However, the wetter climate in eastern Canada exposes black spruce forests to different light, temperature, water, and nutrient conditions. It is not clear to what extent the response of C exchange to climate variability may vary across the Canadian boreal forest. In 2004, year-round eddy covariance flux measurements were made for the first time over an Old Black Spruce (OBS) forest in eastern Canada (EOBS, Quebec) concurrently with two other pre-existing OBS sites in central Canada (SOBS, Saskatchewan and NOBS, Manitoba). The current study took advantage of this initial opportunity to compare and contrast three OBS sites located in different climatic regions of Canada. The response of daily R to soil temperature was significantly different among sites (Fig 4a). These daily differences were also reflected at the half hour scale. Table 1. Annual totals of NEP, R, and GEP in g C m-2 y-1. Uncertainties correspond to gap filling error estimates. Daily GEP was independent of light during the cold season (Dec – Apr) but also during the first part of the growing season (Apr – Jul) (Fig. 3). Air temperature explained most of the variability in GEP at the daily time scale. The relationships were not significantly different among sites using a linear function on log-transformed GEP data. The temperature response of GEP was best described using a logistic function (Fig 4b). Relative GEP (ratio of daily GEP : maximum value of daily GEP) was used to take into account the pattern towards the maximum photosynthetic capacity. According to a residual analysis, incident light affected the response of daily GEP to air temperature In 2004, NOBS and SOBS were weak C sinks of similar strength, while EOBS was C neutral. The annual sums of GEP and R were highest at SOBS , intermediate at EOBS, and lowest at NOBS, which was consistent with growing season length. However, GEP totals at NOBS and EOBS were similar. Fig 3. Response of total daily GEP to light. (monthly averages ± SE) Seasonal Patterns Objectives • NEP seasonal pattern was similar among sites : • Sites were C sinks from May through September ; • Maximum NEP occurred in June at all three sites ; • NEP depression in July yielded similar NEP totals among sites. • Sites’ specificities: • C losses were higher at EOBS from January to March. • C gains began first at SOBS in April and last at NOBS in May. • GEP and R totals were lower in June and July at EOBS. • GEP and R totals peaked in July at SOBS and NOBS and in August at EOBS. • GEP and R decline in autumn was fastest at NOBS and slowest at EOBS. • Quantify the annual NEP, R, and GEP of three mature black spruce stands located in three different climatic regions of Canada ; • Differentiate the contribution of R and GEP to NEP that occurred in spring, summer, autumn, and winter between sites ; • Isolate environmental factors at the three flux sites that can explain the variability of R and GEP occurring at different time scales. Site Characteristics Fig 4. The response of total daily (a) R and (b) GEP to mean daily temperature. (2 °C bin averages ± SE) Monthly Response to Temperature The responses of monthly R and GEP to soil and air temperatures, respectively, were not different among sites. The response of R to temperature was exponential, while GEP increased linearly with temperature (Fig. 5). From residual analysis, soil water content was the only variable significantly affecting the response of R to temperature (Fig. 6). O. Bergeron§, H.A. Margolis§, T.A. Black†, C. Coursolle§, A.L. Dunnф, A.G. Barr¶, S.C. Wofsyф Environmental Conditions Fig 2. Time series of monthly totals of (a) NEP, (b) R, and (c) GEP. EOBS received lower amounts of incident light from May to July (Fig. 1a). Air temperatures were higher at SOBS in April and May (Fig. 1b). The snowpack was thicker and persisted longer at EOBS (Fig. 1c). The soil (5 cm depth) was generally cooler at NOBS and did not freeze in winter at EOBS (Fig. 1d). Soil temperatures were highest at EOBS from July through December. Soil water content (5 cm depth) decreased only at EOBS during the growing season (Fig. 1e). Water tables were near the surface at SOBS throughout the growing season. At NOBS and EOBS, water table depth was similar from May to July, but sharply declined in August at EOBS (Fig. 1f). Fig 5. Response of total monthly (a) R and (b) GEP to temperature. In (b), months with mean air temperature below -5 °C were discarded to attain homoscedasticity. Fig 6. Residuals of total monthly R as a function of soil water content. Physiological Parameters Table 2. Light response curve parameters and coefficients of respiration response to soil temperature. Relationships developed with half-hour non-gap-filled measurements. Superscripts indicate significant differences. Conclusions • In 2004, SOBS and NOBS were weak C sinks and EOBS was C neutral. Total annual GEP and R were highest at SOBS and lowest at NOBS. • Overall, all three sites showed very similar seasonal patterns of C fluxes. However, EOBS showed higher winter C losses associated with warmer soil under thicker snowpack and SOBS began fixing C almost one month before NOBS. • From half-hour measurements, all three sites showed different light response curve parameters and a specific R response to soil temperature. • Temperature drove both GEP and R at the daily and monthly scales. • At the daily scale, R response to soil temperature was site specific. GEP response to air temperature was not different among sites and was affected by the quantity of incident light. • At the monthly time scale, all three sites showed a similar response to temperature. Soil water content affected the response of R to soil temperature. GEP response to light was characterised with a rectangular hyperbolic function (GEP = (aGEP GEPmax PPFD) / (aGEP PPFD + GEPmax)) using daytime NEP – R measurements. Only measurements made under optimal environmental conditions (15 < Ta < 25 °C, Ts > 5 °C, VPD < 1.5 kPa, and SWC > 0.15 m3 m-3) were used to factor out intra-annual climatic differences between sites. NOBS showed higher light use efficiency (aGEP) and lower maximum photosynthetic capacity (GEPmax). Highest maximum photosynthetic capacity was observed at SOBS. These differences could reflect site specific climate adaptation. R response to near surface soil temperature was characterised with a Q10 function (R = R10 Q10[(Ts-10) / 10]) using night-time and cold season NEP measurements. Respiration temperature sensitivity (Q10) and basal respiration (R10) were higher at NOBS and lower at EOBS. Inversely, mean annual soil temperatures where lower at NOBS and higher at EOBS. This study was supported by CFCAS, NSERC and BIOCAP Canada. Poster presented at the FCRN 4th Annual Meeting, Victoria, British Columbia, 24-26 Feb 2006. Fig. 1. Selected environmental variables. § Faculté de Foresterie et de Géomatique, Université Laval, Québec, Québec, G1K 7P4 Canada; † Faculty of Agricultural Sciences, 135-2357 Main Mall, University of British Columbia, Vancouver, B.C., V6T 1Z4 Canada ф Department of Earth and Planetary Science, Harvard University, 29 Oxford St., Cambridge, Massachusetts, 02138 USA ; ¶ Climate Research Branch, Meteorological Service of Canada, 11 Innovation Blvd., Saskatoon, Saskatchewan, S7N 3H5 Canada