Download
1 / 8
80 likes | 210 Views
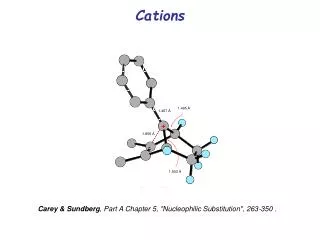
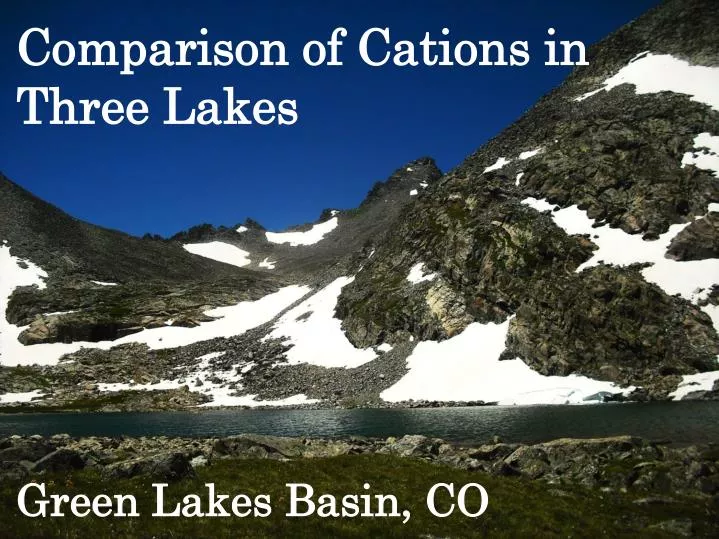
Green Lakes Basin, CO. Comparison of Cations in Three Lakes. Red rectangles = sampling locations Blue arrows = direction of stream flow. Green Lakes Basin, CO. Continental Divide. Methods. Look at concentrations of Ca 2+ , Mg 2+ , Na + , and K + from 1982 to 2006.

E N D
Green Lakes Basin, CO Comparison of Cations in Three Lakes
Red rectangles = sampling locations Blue arrows = direction of stream flow Green Lakes Basin, CO Continental Divide
Methods • Look at concentrations of Ca2+, Mg2+, Na+, and K+ from 1982 to 2006. • F-test – are the variances the same? • T-test – are the means the same? • χ2 test – are the distributions normal?
Conclusions • Green Lakes 1, 4, and 5 have different cation chemistries • Variances and means are not the same • None of the data are normally distributed • GL4 has higher concentrations than GL5 • Inputs from hillslopes and from GL5 • GL1 is the most different of the three • Ca2+ and Na+ concentrations are much higher • Possibly a different rock type