Download
1 / 25
250 likes | 254 Views
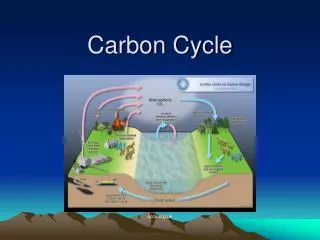
NERC CarbonFusion. Improving carbon cycle models with radar retrievals of forest biomass data. Mathew Williams, Tim Hill and Casey Ryan School of GeoSciences, University of Edinburgh. Modelling the terrestrial C cycle. Biomass information affects NEP estimates. Orchidee-FM. Assume stand

E N D
NERC CarbonFusion Improving carbon cycle models with radar retrievals of forest biomass data Mathew Williams, Tim Hill and Casey Ryan School of GeoSciences, University of Edinburgh
Biomass information affects NEP estimates Orchidee-FM Assume stand are 40-50 yrs Estimate age from biomass Source: P Peylin
DCw = awNPP – tw Cw – P FCw Cw = wood C aw = allocation of NPP to wood tw = turnover rate of wood (lifespan) P = probability of disturbance F = fraction of wood lost in disturbance (intensity) Disturbance magnitude M = PF, spans degradation-deforestation Biomass dynamics (AGB)
Tropical woodlands • the only biome determined by demography rather than by climate (Bond, 2008)
Mozambican woodland biomass Frequency Stem biomass (tC/ha)
Biomass-Backscatter relationship - PALSAR 96 ground calibration and validation plots (0.2-3 ha) Forest, woodland and cropland 10 x images from 2007-2010 Regression ~stable Mean R2 = 0.50 Validation (holdout) RMSE = 9.8 tC/ha Bias = 1.6 tC/ha Ryan et al, in press (GCB)
Spatial distributions and land use Heavily deforested undisturbed Village Fire protected Town and hinterland Newly colonised Village Ryan et al, in press (GCB)
Definition of test scenarios • Synthetic experiment: Disturbance intensity (M = PF, vary all) • Mozambican experiment • Disturbed area (Mbalawa) • Protected area (Gorongosa Park) ALOS-PALSAR data
Mean disturbance flux Variability in disturbance characteristics is linked to variability in disturbance fluxes Mean disturbance flux
Summary • ALOS-PALSAR can produce biomass maps with confidence intervals • PDFs contain information on forest disturbance processes • Data assimilation has potential to provide novel information on biomass loss, with improved flux constraint in models • Next steps: evaluate global biomass products, explore spatial pattern information, transient disturbance, link to fire products
Acknowledgements: John Grace, Emily Woollen, Ed Mitchard, Iain Woodhouse Thank you Funding: NERC, ESA, EU
Assimilation Approach • Generate PDF of differences in biomass from sequential SAR images • Generate simulated PDF of differences for a range of P, F (ensemble runs) with noise added • Compare similarity of observed and modelled difference PDFs • Most similar modelled difference PDFs were deemed most likely, and used to infer the driving disturbance regime