Download
1 / 11
110 likes | 124 Views
5.1 Modeling Data with Quadratic Functions. Objectives: To identify quadratic functions and graphs and to model data with quadratic functions. Critical Thinking:. Investigate: As the side lengths of a square increase by 1, what happens to its perimeter and its area?

E N D
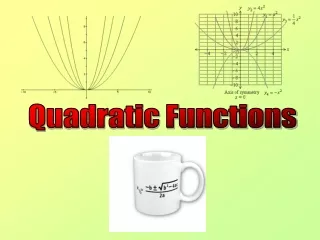
5.1 Modeling Data with Quadratic Functions Objectives: To identify quadratic functions and graphs and to model data with quadratic functions
Critical Thinking: • Investigate: • As the side lengths of a square increase by 1, what happens to its perimeter and its area? • Find a general rule to represent the relationship between any side length and its perimeter and area.
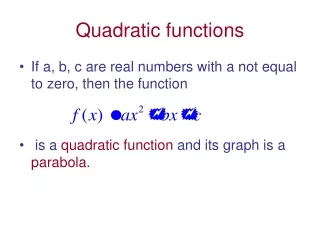
Quadratic Functions f(x) = 3x2 - 7 y = 2x2 + 3x + 4 f(x) = -10x2 – 3x y = (x + 2)(x + 3)
Quadratic Function A function of degree two; the largest exponent in the function is two Standard Form f(x) = ax2 + bx + c; Quadratic term Linear term Constant term a ≠ 0
Determine if the following is linear or quadratic. Identify the quadratic, linear, and constant terms. f(x) = (x + 2)(x – 7) f(x) = (x2 + 5x) – x2
Graphs of a Quadratic Function Parabolas Vertex(max/min) (2, 0)
Identify the vertex and the axis of symmetry of each parabola. Identify points corresponding to P and Q.
Finding a Quadratic Model Find a quadratic function that goes through (1, 0), (2, -3), and (3, 10) By hand… Substitute the values of x and y into y = ax2 + bx + c and solve the system of equations with three variables
Finding a Quadratic Model Using a graphing calculator… Enter the data into calc STAT, Edit Find equation STAT, CALC, QuadReg, Enter The table at the below shows the height of a column of water as it drains from its container. Model the data with a quadratic function. Use the model to estimate the water level at 35 seconds.
Homework Pg 237 #1-16, 20-22, 32-36 even