Download
1 / 14
140 likes | 335 Views
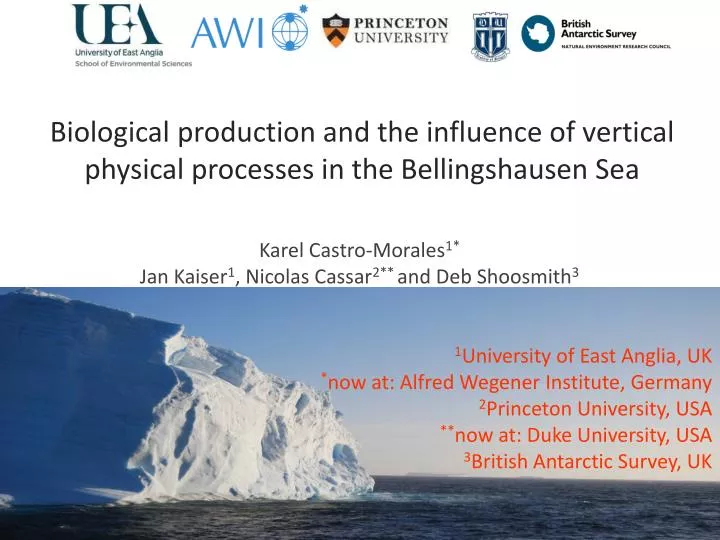
Karel Castro-Morales 1* Jan Kaiser 1 , Nicolas Cassar 2** and Deb Shoosmith 3 1 University of East Anglia, UK * now at: Alfred Wegener Institute, Germany 2 Princeton University, USA ** now at: Duke University, USA 3 British Antarctic Survey, UK.

E N D
Karel Castro-Morales1* Jan Kaiser1, Nicolas Cassar2** and Deb Shoosmith3 1University of East Anglia, UK *now at: Alfred Wegener Institute, Germany 2Princeton University, USA **now at: Duke University, USA 3British Antarctic Survey, UK Biological production and the influence of vertical physical processes in the Bellingshausen Sea
67.5°S 70.0°S 72.5°S Wilkins Ice Shelf Antarctic Peninsula Alexander Island George VI Ice Shelf 90°W 85°W 80°W 75°W 70°W 65°W 60°W Bellingshausen Sea, West Antarctic Peninsula Seawater temperature rise ~ 0.5 oC/decade in the upper 100 m (Meredith and King, 2005) Adelaide Island Charcot Is. Latady Is. Beeth. Pen. Eltanin Bay Ronne Entr. Meredith et al., 2010 D. R. Shoosmith
WAI MB2 MB1 BT WIS 03/03/07 10/04/07 Location of marginal ice zone and zonal separation 3 March to 9 April, 2007 (38 days) - “RRS James Clark Ross” 253 hydrographic stations, CTD-O2 and the different flavours of oxygen at the surface Permanent Open Ocean Zone (POOZ) Marguerite Bay 2 (MB2) Belgica Trough (BT) West Adelaide Island (WAI) 253 hydrographic stations (CTD-O2) ADCP, ice cores, Drifters, d18O (H2O) Winter Sea Ice Zone (WSIZ) Wilkins Ice Shelf (WIS) Marguerite Bay 1 (MB1) AMSR-E, Ice 0.3 (Advanced Microwave Scanning Radiometer - Earth Observing System, NASA)
Ice conditions during sampling Station 10 (Wilkins Ice Shelf) Marguerite Bay 1
6CO2 + 6H2O (+ light) C6H12O6 + 6O2 Ar O2 Total sea-air flux of O2 (optode / Winkler) k = 0.27( u102 ) (Sc / 660)-0.5 (Sweeney et al., 2007) ≈N zmix ~ Ar O2 O2 Biological O2 flux (MIMS) Gross O2 production (dual-delta method; IRMS Kaiser, 2011) Hendricks et al., 2004; Reuer et al., 2007 Luz and Barkan, 2000 & 2009
Contribution of physical effects in a mixed layer O2 mass balance N Ar O2 Diapycnal flux (Fv) u Dzmix = zmix – zmix-30 days O2 zmix zmix ; c(O2) > 0.5 % wrt 10 m (Castro-Morales and Kaiser, 2011) zmix–30 days=zmix_BM04 – 8 m (de Boyer Montegut et al., 2004) Fv Fe Dzmix + + - Entrainment (Fe)
Fbio (kw, D(O2/Ar)) Total and biological sea-to-air O2 fluxes outgassing mmol m-2 d-1 mmol m-2 d-1 Fg (kw, D(O2)) ingassing WSIZ - Positive biological O2 flux POOZ - “Negative” biological O2 flux (?)
Role of the vertical stability Brunt-Väisälä frequency (v2) vs. Fbio Vertical stability, enhanced by MW, as an important factor for the biological O2 production (important source of nutrients and algae) n2 AASW MW
AASW + WW AASW MW Dzmix (m) Entrainment from the historical evolution of the mixed layer depth shallower deeper
West Adelaide Island Marguerite Bay 2 Belgica Trough Flux / (mmol m-2 d-1) Wilkins Ice Shelf Marguerite Bay 1 Fv Fe Fbio N = Fbio + Fv + Fe Contribution of physical effects to N
R2 = 0.29 17Deq 17D G2 G1 G / (mmol m-2 d-1) 17D / (ppm) G / (mmol m-2 d-1) In WSIZ, contribution of MW with higher photosynthetic O2. In POOZ possible entrainment of 17D stored in the WW due to deepening of zmix(WAI) G from two different pairs of 17dp and 18dp (Barkan and Luz, 2011; Kaiser and Abe, 2012) 17O excess (17D) from simple form: 17D 17d– 0.517918d 17Deq = 0.6 T +1.8 (T in °C; Luz and Barkan, 2009) 17Dmax= 180 ppm 17Deq(T)= 1.6 ppm 17Dair = 0 ppm
G / (mmol m-2 d-1) Comparison to other studies Hendricks et al., 2004 March, 2000 (70-65 S, 98-67 W) 65º 70º 75º 80º 85º 90º 95º 100º Longitude / (W) Huang et al., 2012 (north of our POOZ, peak of growing season) Off Marguerite Bay: 17D = (27±22) ppm Here (WAI): 17D = (24±10) ppm (Lack of 17d and 18d data from supplementary material)
Summary • Physical effects must not be neglected in future corrections to N (and G). Can account for large portion of “negative” Fbio. If not, misleading results or difficult to interpret. • Contribution of upwelling and horizontal influence must be included • Vertical measurements of O2/Ar and TOI must be considered • As sea-ice melt water increases in the Bellingshausen Sea continental shelf, the variability of the marine productivity will be also affected (longer phytoplankton growing periods) with possible increase in carbon export to deep ocean Castro-Morales et al., 2013, Biogeosciences
Acknowledgements National Council for Science and Technology (CONACyT) Mexico A. Jenkins (BAS) Antarctic Climate and the Earth System Forcings from the Oceans, Clouds, Atmosphere and Sea-ice (ACES-FOCAS) (JR165) NERC M. Bender (PU); NSF and NASA