Download
1 / 1
10 likes | 116 Views
B. A. A. C. D. 350. IN SITU AND REMOTE SENSING ESTIMATED PRIMARY PRODUCTION IN THE SOUTHERN CALIFORNIA CURRENT REGION, 1998-2002. J.C.A. CEPEDA-MORALES 1 and G. GAXIOLA-CASTRO 2. E-mail: jcepeda@cicese.mx 1 ; ggaxiola@cicese.mx 2.

E N D
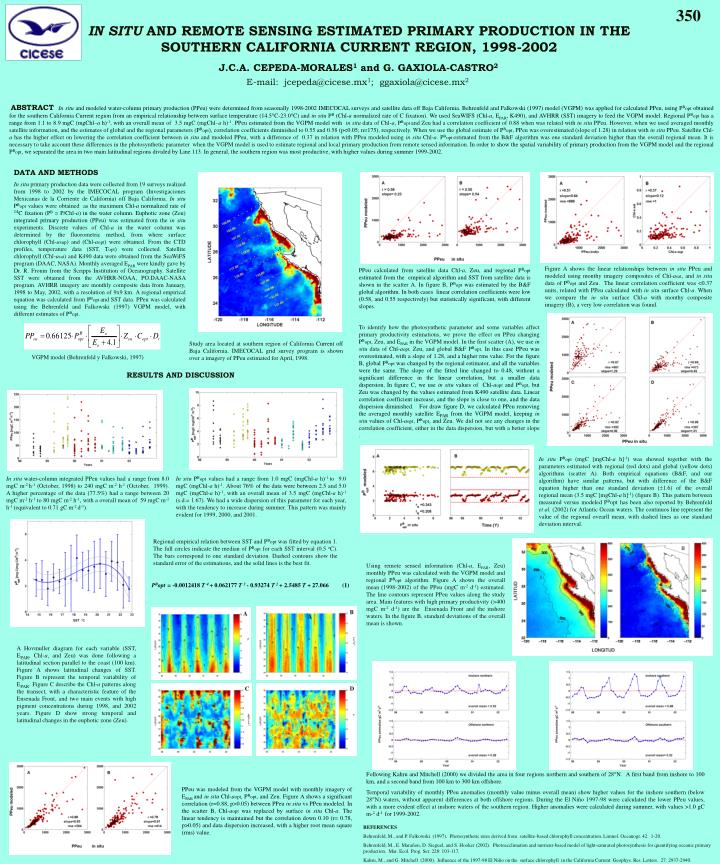
B A A C D 350 IN SITU AND REMOTE SENSING ESTIMATED PRIMARY PRODUCTION IN THE SOUTHERN CALIFORNIA CURRENT REGION, 1998-2002 J.C.A. CEPEDA-MORALES1 and G. GAXIOLA-CASTRO2 E-mail: jcepeda@cicese.mx1; ggaxiola@cicese.mx2 ABSTRACTIn situ and modeled water-column primary production (PPeu) were determined from seasonally 1998-2002 IMECOCAL surveys and satellite data off Baja California. Behrenfeld and Falkowski (1997) model (VGPM) was applied for calculated PPeu, using PBopt obtained for the southern California Current region from an empirical relationship between surface temperature (14.5°C-23.0°C) and in situ PB (Chl-a normalized rate of C fixation). We used SeaWIFS (Chl-a, EPAR, K490), and AVHRR (SST) imagery to feed the VGPM model. Regional PBopt has a range from 1.1 to 8.9 mgC (mgChl–a h)-1, with an overall mean of 3.5 mgC (mgChl–a h)-1. PPeu estimated from the VGPM model with in situ data of Chl-a, PBoptand Zeu had a correlation coefficient of 0.88 when was related with in situ PPeu. However, when we used averaged monthly satellite information, and the estimates of global and the regional parameters (PBopt), correlation coefficients diminished to 0.55 and 0.58 (p<0.05; n=175), respectively. When we use the global estimate of PBopt, PPeu was overestimated (slope of 1.28) in relation with in situ PPeu. Satellite Chl-a has the higher effect on lowering the correlation coefficient between in situ and modeled PPeu, with a difference of 0.37 in relation with PPeu modeled using in situ Chl-a. PBoptestimated from the B&F algorithm was one standard deviation higher than the overall regional mean. It is necessary to take account these differences in the photosynthetic parameter when the VGPM model is used to estimate regional and local primary production from remote sensed information. In order to show the spatial variability of primary production from the VGPM model and the regional PBopt, we separated the area in two main latitudinal regions divided by Line 113. In general, the southern region was most productive, with higher values during summer 1999-2002. DATA AND METHODS In situ primary production data were collected from 19 surveys realized from 1998 to 2002 by the IMECOCAL program (Investigaciones Mexicanas de la Corriente de California) off Baja California. In situPBoptvalues were obtained as the maximum Chl-a normalized rate of 14C fixation (PB= P/Chl-a) in the water column. Euphotic zone (Zeu) integrated primary production (PPeu) was estimated from the in situ experiments. Discrete values of Chl-a in the water column was determined by the fluorometric method, from where surface chlorophyll (Chl-asup) and (Chl-aopt) were obtained. From the CTD profiles, temperature data (SST, Topt) were collected. Satellite chlorophyll (Chl-asat) and K490 data were obtained from the SeaWiFS program (DAAC, NASA). Monthly averaged EPAR were kindly gave by Dr. R. Frouin from the Scripps Institution of Oceanography. Satellite SST were obtained from the AVHRR-NOAA, PO.DAAC-NASA program. AVHRR imagery are monthly composite data from January, 1998 to May, 2002, with a resolution of 9x9 km. A regional empirical equation was calculated from PBoptand SST data. PPeu was calculated using the Behrenfeld and Falkowski (1997) VGPM model, with different estimates of PBopt. Figure A shows the linear relationships between in situ PPeu and modeled using monthy imagery composites of Chl-asat, and in situ data of PBopt and Zeu. The linear correlation coefficient was <0.37 units, related with PPeu calculated with in situ surface Chl-a. When we compare the in situ surface Chl-a with monthy composite imagery (B), a very low correlation was found. PPeu calculated from satellite data Chl-a, Zeu, and regional PBopt estimated from the empirical algorithm and SST from satellite data is shown in the scatter A. In figure B, PBoptwas estimated by the B&F global algorithm. In both cases linear correlation coefficients were low (0.58, and 0.55 respectively) but statistically significant, with different slopes. To identify how the photosynthetic parameter and some variables affect primary productivity estimations, we prove the effect on PPeu changing PBopt, Zeu, and EPAR in the VGPM model. In the first scatter (A), we use in situ data of Chl-aopt, Zeu, and global B&F PBopt. In this case PPeu was overestimated, with a slope of 1.28, and a higher rms value. For the figure B, global PBopt was changed by the regional estimator, and all the variables were the same. The slope of the fitted line changed to 0.48, without a significant difference in the linear correlation, but a smaller data dispersion. In figure C, we use in situ values of Chl-aopt and PBopt, but Zeu was changed by the values estimated from K490 satellite data. Linear correlation coefficient increase, and the slope is close to one, and the data dispersion diminished. For draw figure D, we calculated PPeu removing the averaged monthly satellite EPAR from the VGPM model, keeping in situ values of Chl-aopt, PBopt, and Zeu. We did not see any changes in the correlation coefficient, either in the data dispersion, but with a better slope . Study area located at southern region of California Current off Baja California. IMECOCAL grid survey program is shown over a imagery of PPeu estimated for April, 1998. VGPM model (Behrenfeld y Falkowski, 1997) RESULTS AND DISCUSSION In situPBopt (mgC [mgChl-a h]-1) was showed together with the parameters estimated with regional (red dots) and global (yellow dots) algorithms (scatter A). Both empirical equations (B&F, and our algorithm) have similar patterns, but with difference of the B&F equation higher than one standard deviation (1.6) of the overall regional mean (3.5 mgC [mgChl-a h]-1) (figure B). This pattern between measured versus modeled PBopt has been also reported by Behrenfeld et al. (2002) for Atlantic Ocean waters. The continuos line represent the value of the regional ovearll mean, with dashed lines as one standard deviation interval. In situ water-column integratedPPeu values had a range from 8.0 mgCm-2h-1(October, 1998) to 240 mgC m-2 h-1(October, 1999). A higher percentage of the data (77.5%)had a range between 20 mgC m-2 h-1to 80 mgC m-2 h-1, with a overall mean of 59 mgC m-2h-1(equivalent to 0.71 gC m-2 d-1). In situPBopt values had a range from 1.0 mgC (mgChl-a h)-1 to 9.0 mgC (mgChl-a h)-1. About 76% of the data were between 2.5 and 5.0 mgC (mgChl-a h)-1, with an overall mean of 3.5 mgC (mgChl-a h)-1 (s.d.= 1.67). We had a wide dispersion of this parameter for each year, with the tendency to increase during summer. This pattern was mainly evident for 1999, 2000, and 2001. Regional empirical relation between SST and PBopt was fitted by equation 1. The full circles indicate the median of PBopt for each SST interval (0.5 oC). The bars correspond to one standard deviation. Dashed contours show the standard error of the estimations, and the solid lines is the best fit. Using remote sensed information (Chl-a, EPAR, Zeu) monthlyPPeu was calculated with the VGPM model and regional PBopt algorithm. Figure A shows the overall mean (1998-2002) of the PPeu (mgC m-2 d-1) estimated. The line contours represent PPeu values along the study area. Main features with high primary productivity (>400 mgC m-2 d-1) are the Ensenada Front and the inshore waters. In the figure B, standard deviations of the overall mean is shown. PBopt= -0.0012418 T 4+ 0.062177 T 3- 0.93274 T 2+ 2.5485 T + 27.066 (1) A Hovmuller diagram for each variable (SST, EPAR, Chl-a, and Zeu) was done following a latitudinal section parallel to the coast (100 km). Figure A shows latitudinal changes of SST. Figure B represent the temporal variability of EPAR. Figure C describe the Chl-a patterns along the transect, with a characteristic feature of the Ensenada Front, and two main events with high pigment concentrations during 1998, and 2002 years. Figure D show strong temporal and latitudinal changes in the euphotic zone (Zeu). Following Kahru and Mitchell (2000) we divided the area in four regions northern and southern of 28N. A first band from inshore to 100 km, and a second band from 100 km to 300 km offshore. Temporal variability of monthly PPeu anomalies (monthly value minus overall mean) show higher values for the inshore southern (below 28°N) waters, without apparent differences at both offshore regions. During the El Niño 1997-98 were calculated the lower PPeu values, with a more evident effect at inshore waters of the southern region. Higher anomalies were calculated during summer, with values >1.0 gC m-2 d-1 for 1999-2002. PPeu was modeled from the VGPM model with monthly imagery of EPARand in situ Chl-aopt, PBopt, and Zeu. Figure A shows a significant correlation (r=0.88, p>0.05) between PPeu in situ vs PPeu modeled. In the scatter B, Chl-aopt was replaced by surface in situ Chl-a. The linear tendency is maintained but the correlation down 0.10 (r= 0.78, p>0.05) and data dispersion increased, with a higher root mean square (rms) value. REFERENCES Behrenfeld, M., and P. Falkowski. (1997). Photosynthetic rates derived from satellite-based chlorophyll concentration. Limnol. Oceanogr. 42. 1-20. Behrenfeld, M., E. Marañon, D. Sieguel, and S. Hooker (2002). Photoacclimation and nutrient-based model of light-saturated photosynthesis for quantifying oceanic primary production. Mar. Ecol. Prog. Ser. 228: 103-117. Kahru, M., and G. Mitchell (2000). Influence of the 1997-98 El Niño on the surface chlorophyll in the California Current. Geophys. Res. Letters. 27: 2937-2940.