Download
1 / 21
220 likes | 404 Views
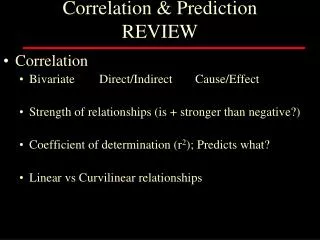
Correlation & Prediction REVIEW. Correlation Bivariate Direct/Indirect Cause/Effect Strength of relationships (is + stronger than negative?) Coefficient of determination (r 2 ); Predicts what? Linear vs Curvilinear relationships. Table 5-2 Variable Classification. Independent Dependent

E N D
Correlation & PredictionREVIEW • Correlation • Bivariate Direct/Indirect Cause/Effect • Strength of relationships (is + stronger than negative?) • Coefficient of determination (r2); Predicts what? • Linear vs Curvilinear relationships
Table 5-2Variable Classification IndependentDependent Presumed cause Presumed effect The antecedent The consequence Manipulated/measured by researcher Outcome (measured) Predicted from Predicted to Predictor Criterion X Y
Some Examples • Chi-SquareGender and knee injuries in collegiate basketball players • Independent t-testDifferences in girls and boys (independent groups; mutually exclusive) • Dependent t-testPre and Post measurement of same group or matched pairs (siblings) • One-Way ANOVADefensive ability (1, 2 or 3) and throwing distance (IV of >2 levels)
Norm-Referenced Measurement HPER 3150 Dr. Ayers
Topics for Discussion • Reliability (variance & PPM correlation support reliability & validity) Consistency Repeatability • Validity Truthfulness • Objectivity Inter-rater reliability
Observed, Error, and True Scores Observed Score = True Score + Error Score ALL scores have true and error portions
There is variation in observed, true & error scores • Error can be + or – (increase/decrease observed scores) • Error scores contribute LITTLE to observed variation • S2o = S2t + S2e
ReliabilityTHIS IS HUGE!!!! Reliability is that proportion of observed score variance that is true score variance TIP: use algebra to move S2t to stand alone S2o = S2t + S2e
Table 6-1Systolic Blood Pressure Recordings for 10 Subjects Subject Observed BP = True BP + Error BP 1 103 105 -2 2 117 115 +2 3 116 120 -4 4 123 125 -2 5 127 125 +2 6 125 125 0 7 135 125 +10 8 126 130 -4 9 133 135 -2 10 145 145 0 Sum (S) 1250 1250 0 Mean (M) 125.0 125.0 0 Variance (S2) 133.6 116.716.9 S 11.6 10.8 4.1
Reliability Coefficients • Interclass Reliability • Correlates 2 trials • Intraclass Reliability • Correlates >2 trials
Interclass Reliability (Pearson Product Moment) • Test Retest (administer test 2x & correlate scores) • See Excel document (Norm-ref msmt examples) • Time, fatigue, practice effect • Equivalence (create 2 “equivalent” test forms) • Odd/Even test items on a single test • Addresses most of the test/retest issues • Reduces test size 50% • Split Halves • Spearman-Brown prophecy formula
Spearman Brown Prophecy Formula k = the number of items I WANT to estimate the reliability for divided by the number of items I HAVE reliability for
Table 6-3Odd and Even Scores for 10 Subjects Subject Odd Even 1 12 13 2 9 11 3 10 8 4 9 6 5 11 8 6 7 10 7 9 9 8 12 10 9 5 4 10 8 7 Sum (S) 92 86 Mean 9.2 8.6 S 2.2 2.6 Variance (S2) 4.8 6.7 Assume a 30-item test rxx’ = .639 (low but test is only 15 items)
Are these two trials consistent? Subject Trial 1 Trial 2 1 15 25 2 17 27 3 10 20 4 20 30 5 23 33 6 26 36 7 27 37 8 30 40 9 32 42 10 33 43 Sum (S) 233 333 Mean 23.3 33.3 S 7.7 7.7 Variance (S2) 59.1 59.1 All scores changed by 10 points If reliability= consistency, how can you calculate reliability considering a constant change in scores? rxx’ = 1.00
Intraclass Reliability ANOVA ModelCronbach's alpha coefficient Alpha Coefficient K = # trials (different than in the Spearman-Brown prophecy formula)
Intraclass (ANOVA) ReliabilitiesCommon terms you will encounter • Alpha Reliability • Kuder Richardson Formula 20 (KR20) (items scored 0/1) • Kuder-Richardson Formula 21 (KR21) • ANOVA reliabilities
All are calculated the same: partition total variance in scores into PEOPLEtotal variance between participants (total or observed S2) TRIALS variance across trials (error S2) PEOPLE-BY-TRIALS not everyone performs equally differently across trials (error S2)
Table 6-6Calculating the Alpha Coefficient Subject Trial 1 Trial 2 Trial 3 Total 1 3 5 3 11 2 2 2 2 6 3 6 5 3 14 4 5 3 5 13 5 3 4 4 11 SX 19 19 17 55 SX2 83 79 63 643 S22.70 1.70 1.30 9.50 K = # trials
Index of Reliability The theoretical correlation between observed scores and true scores Square root of the reliability coefficient