Download
1 / 47
480 likes | 624 Views
Lectures for 4Y03 (a) Efficiency in Bacterial Cells (b)Codon Usage Bias (c) Mitochondrial Genomes. Paul Higgs Dept. of Physics, McMaster University, Hamilton, Ontario. Efficiency in the Genome Small organisms care about DNA replication time. No wasted space

E N D
Lectures for 4Y03(a) Efficiency in Bacterial Cells(b)Codon Usage Bias (c) Mitochondrial Genomes Paul Higgs Dept. of Physics, McMaster University, Hamilton, Ontario.
Efficiency in the Genome • Small organisms care about DNA replication time. • No wasted space • 1 gene per 1000 bases in prokaryotes • Haemophilus influenzae • 1762 genes in 1.8 Mb • Human • 23000 genes in 3080 Mb • Eukaryotic genomes have lots of transposons and repetitive sequences. Hou and Lin – PLoS ONE 2009
Most genes in bacteria are single copy genes, but rRNA and tRNA genes are often duplicated. Sharp et al (2005)
rRNA Duplicate rRNA genes means faster synthesis of rRNA molecules Ribosomal protein genes are not duplicated. Many proteins can be synthesized from each mRNA mRNA protein
Correlation between time of colony appearance and rRNA operon copy number. More tRNA genes in rapidly growing bacteria Rocha (2004) Genome Research Klappenbach J A et al. Appl. Environ. Microbiol. 2000;66:1328-1333
How many tRNA gene copies are present in genomes? Evidence for Translational selection #1 More gene copies More tRNA molecules More rapidly multiplying bacteria
Changes in tRNA content of genomes from bacteria to mitochondria Only one type of tRNA remains for each codon family in human mitochondria. Still need 2 tRNAs for Leu and Ser. Therefore 22 in total. # denotes intracellular parasite or endosymbiont. Small size genomes in bacteria also have reduced numbers of tRNAs.
More tRNA gene copies for amino acids that are more frequent in protein sequences Duret (2000)
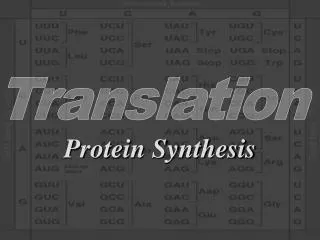
Standard Genetic Code UUU UUC UUA UUG UCU UCC UCA UCG UAU UAC UAA UAG Phe Phe Leu Leu Ser Ser Ser Ser Tyr Tyr * * Cys Cys * Trp UGU UGC UGA UGG Leu Leu Leu Leu CUU CUC CUA CUG CCU CCC CCA CCG His His Gln Gln CAU CAC CAA CAG Arg Arg Arg Arg CGU CGC CGA CGG ACU ACC ACA ACG Ile Ile Ile Met Thr Thr Thr Thr Asn Asn Lys Lys Ser Ser Arg Arg AGU AGC AGA AGG AUU AUC AUA AUG AAU AAC AAA AAG GUU GUC GUA GUG GCU GCC GCA GCG Val Val Val Val Ala Ala Ala Ala Asp Asp Glu Glu Gly Gly Gly Gly GGU GGC GGA GGG GAU GAC GAA GAG Pro Pro Pro Pro
tRNA structure Wobble position Codon-anticodon pairing A C G 3 2 1 3’ 5’
How many different tRNAs do we need ? Two codon U+C families Two codon A+G families codon anticodon Asp GAU Asp GAC GUC codon anticodon Glu GAA UUC Glu GAG CUC U G C Always a wobble-G tRNA only Always a wobble-U tRNA Sometimes a wobble-C tRNA
Selection-Mutation-Drift Theory Li (1987), Shields (1990), Bulmer (1991) u In absence of selection the relative frequency of C is u(1-) In presence of selection the relative frequency of C is 1 1+s U C where S = 2Nes. 1when S is large = when S = 0
Estimate S from sequence data – U+C families Assume S is negligible in low expression genes, but significant in high expression genes. S is positive in all these examples. C codon is always preferred. U G C
Estimate S from sequence data – A+G families Positive S means G is preferred. Negative S means A is preferred. This depends on which tRNA genes are present.
Selection on codon usage is strongest in the organisms where rRNAs and tRNAs are highly duplicated. These are the fastest growing ones. Sharp et al (2005).
Selection on codon usage is strongest in the organisms where tRNAs are highly duplicated. These are the fastest growing ones. Ran and Higgs (2012). codon bias between high and low expression genes growth rate tRNA gene copy number
Codon frequencies in yeast vary smoothly as a function of protein production rate. Shah and Gilchrist (PNAS 2011) log10(protein production rate)
Energetic efficiency of amino acid synthesis Bacteria use cheaper amino acids in highly expressed genes Akashi and Gojobori (2002) PNAS “Expression Level”
Mitochondria are organelles inside eukaryotic cells. They are the site of oxidative phosphorylation and ATP synthesis. They contain their own genome distinct from the DNA in the nucleus. Typical animal mitochondrial genomes are short and circular (~16,000 bases). They usually contain: 2 rRNAs 22 tRNAs 13 proteins
G G C A A A A T C C G T T T T A Small Scale Evolution – Variation in Frequencies of Bases and Amino Acids The two strands of DNA are complementary. Freq of A on one strand = Freq of T on the other Freq of C on one strand = Freq of G on the other If the two strands are subject to the same mutational processes then the freq of any base should be equal (statistically) on both strands. This means that A = T and C = G on any one strand. In this case base frequencies can be described by a single variable: G+C content. BUT – mitochondrial genomes have an asymmetrical replication process. The two strands are not equivalent. The frequencies of bases on the two strands are not equal. On any one strand the frequencies of the four bases may vary independently.
Mitochondrial genome replication Figure from Faith & Pollock (2003) Genetics Rank genes in order of increasing time spent single stranded COI < COII < ATP8 < ATP6 < COIII < ND3 < ND4L < ND4 < ND1 < ND5 <ND2 < Cytb ND6 is on the other strand
The Genetic Code maps the 64 DNA codons to the 20 amino acids. (This version applies to Vertebrate Mitochondria) 4-codon families where the third position is synonymous
Base frequencies at FFD sites in each gene (averaged over mammals) Deamination: C to U and A to G on the heavy strand
Base frequencies at FFD sites are controlled by mutation. Base frequencies at 1st and 2nd positions are influenced by mutation and selection Model fitting (Data from Fish) – assume a fraction of fixed sites and a fraction of neutral sites. Selection at 1st position is weaker than at 2nd
Mutation pressure is sufficient to cause change in amino acid frequencies.
Homo sapiens Strand = + 3624 codons F F L L UUU UUC UUA UUG 69 139 65 11 S S S S UCU UCC UCA UCG 29 99 81 7 Y Y * * UAU UAC UAA UAG 35 89 4 3 C C W W UGU UGC UGA UGG 5 17 90 9 L L L L CUU CUC CUA CUG 65 167 276 42 P PPP CCU CCC CCA CCG 37 119 52 7 H H Q Q CAU CAC CAA CAG 18 79 82 8 R R R R CGU CGC CGA CGG 6 26 28 0 I I M M AUU AUC AUA AUG 112 196 165 32 T T T T ACU ACC ACA ACG 50 155 132 10 N N K K AAU AAC AAA AAG 29 131 84 9 S S * * AGU AGC AGA AGG 11 37 1 0 V V V V GUU GUC GUA GUG 22 45 61 8 A A A A GCU GCC GCA GCG 39 123 79 5 D D E E GAU GAC GAA GAG 12 51 63 15 G G G G GGU GGC GGA GGG 16 87 61 19
Fish - 23 UU 1.250 CU 0.939 GU 0.605 UC 0.756 CC 1.205 GC 0.878 UA 1.030 CA 0.938 GA 1.145 UG 1.274 CG 0.554 GG 1.891 Mammals - 23 UU 0.939 CU 1.101 GU 0.763 UC 0.743 CC 1.163 GC 1.005 UA 1.136 CA 0.906 GA 1.027 UG 1.433 CG 0.552 GG 1.654 Fish - 31 UU 0.933 CU 1.162 AU 0.907 GU 0.911 UC 0.918 CC 1.371 AC 0.739 GC 0.839 UA 1.096 CA 0.849 AA 1.135 GA 0.758 UG 1.049 CG 0.609 AG 1.228 GG 1.499 Mammals - 31 UU 0.855 CU 1.082 AU 0.996 GU 1.115 UC 0.994 CC 1.363 AC 0.797 GC 0.873 UA 1.206 CA 0.945 AA 0.974 GA 0.776 UG 0.856 CG 0.546 AG 1.293 GG 1.369 Frequency ratios Codon bias seems to be a dinucleotide mutational effect in mitochondria, rather than an effect of translational selection. CpG effect.... (increased rate of C to U mutations in CG dinucleotides. Expect high UG and CA) DNA binding proteins....
The OGRe front page: http://ogre.mcmaster.ca Sequence information for OGRe is taken from GenBank.
LOCUS NC_001922 16646 bp DNA circular VRT 20-SEP-2002 DEFINITION Alligator mississippiensis mitochondrion, complete genome. ACCESSION NC_001922 VERSION NC_001922.1 GI:5835540 KEYWORDS . SOURCE mitochondrion Alligator mississippiensis (American alligator) ORGANISM Alligator mississippiensis Eukaryota; Metazoa; Chordata; Craniata; Vertebrata; Euteleostomi; Archosauria; Crocodylidae; Alligatorinae; Alligator. REFERENCE 1 (bases 1 to 16646) AUTHORS Janke,A. and Arnason,U. TITLE The complete mitochondrial genome of Alligator mississippiensis and the separation between recent archosauria (birds and crocodiles) JOURNAL Mol. Biol. Evol. 14 (12), 1266-1272 (1997) MEDLINE 98066357 PUBMED 9402737 FEATURES Location/Qualifiers source 1..16646 /organism="Alligator mississippiensis" /organelle="mitochondrion" /mol_type="genomic DNA" /db_xref="taxon:8496" /tissue_type="liver" /dev_stage="adult" rRNA 1..976 /product="12S ribosomal RNA" tRNA 977..1044 /product="tRNA-Val" /anticodon=(pos:1009..1011,aa:Val) rRNA 1046..2635 /product="16S ribosomal RNA" tRNA 2636..2710 /product="tRNA-Leu" /note="codons recognized: UUR" /anticodon=(pos:2672..2674,aa:Leu) gene 2711..3676 /gene="ND1" CDS 2711..3676 /gene="ND1" An example of a GenBank file Complete mitochondrial genome of the Alligator 1 caacagactt agtcctggtc ttttcattag ctagtactca acttatacat gcaagcatcc 61 gcgaaccagt gagaacaccc tacaagtctg acagacgaat ggagccggca tcaggcacat 121 caaccgatag cccaaaacgc ctagcccagc cacaccccca agggtctcag cagtgattaa 181 ccttaaacca taagcgaaag cttgatttag ttagagtaga tatagaggcg gtcaactctc 241 gtgccagcaa ccgcggttag acgaaaacct caagttaatt gacaaacggc gtaaattgtg 301 gctagaactc tatctccccc attagtgcag atacggtatc acagtagtga taaacttcat 361 cacaccgcaa acatcaacac aaaactggcc ctaatctcaa agatgtactc gattccacga 421 aagctgagaa acaaactggg attagatacc ccactatgct cagcccttaa cattggtgta 481 gtacacaaca gactaccctc gccagagaat tacgagcccc gcttaaaact caaaggactt 541 gacggcactt taaacccccc tagaggagcc tgtcctataa tcgacagtac acgttacacc 601 cgaccacctt tagcctactc agtctgtata ccgccgtcgc aagcccgtcc catttgaggg 661 aaacaaaacg cgcgcaacag ctcaaccgag ctaacacgtc aggtcaaggt gcagccaaca 721 aggtggaaga gatgggctac attttctcaa catgtagaaa tattcaacgg agagccctat 781 gaaatacagg actgtcaaag ccggatttag cagtaaactg ggaaagaata cctagttgaa 841 gtcggtaacg aagtgcgtac acaccgcccg tcaccctcct cgaacccaac aaaatgccca 901 aacaacaggc acaatgttgg gcaagatggg gaaagtcgta acaaggtaag cgtaccggaa 961 ggtgcacttg gaacatcaaa atgtagctta aatttaaagc attcagttta cacctgaaaa 1021 agtcccacca tcggaccatt ttgaaaccca tatctagccc tacctccttt caacatgctt
OGRe (= Organellar Genome Retrieval) is a relational database. available at http://ogre.mcmaster.ca More than 1000 complete animal mitochondrial genomes. Efficient means of storage and retrieval of information. Uses PostgreSQL Schema defines relationships between different types of information.
Species may be selected individually from an alphabetical list Or taxa may be selected from a hierarchy. Here the Arthropods have been expanded and the Myriapods and Crustaceans have been selected
Large Scale – Evolution of Gene Order in Whole Genomes On the ogre web site, a visual comparison can be made of any two selected species. Colour is used to indicate conserved blocks of genes. Alligator and Bird genomes differ by interchange of two tRNA genes (red and yellow)… …and by translocation of the two genes in the blue block.
A B C D A (B C) D A D B C A B C B C D A B C D A C B D Translocations: Duplications and deletions / / Genome reshuffling mechanisms Inversions: C -C -B B A D A D
Example of an inversion Example of a translocation
The T and –F genes are duplicated in Cordylus warreni. If the first T and the second –P were deleted, the relative position of T and –P would change.
Sometimes things go crazy …. Drosophila and Thrips are both insects yet there are 30 breakpoints for only 37 genes i.e. almost nothing in common.
OGRe contains gene orders as strings. This allows searching and comparison. 231 unique gene orders have been found in 858 species. The standard vertebrate order is shared by 398 species (including humans). There are many other species with unique gene orders. Some species conserve gene order over 100s of millions of years. Others get scrambled in a few million. Still to do (new project) : - estimate relative rates of different rearrangement processes - predict most likely ancestral gene orders - use gene order evidence in phylogenetics
Arthropod phylogenetics Very difficult due to strong variation in rates of evolution between species. tRNA tree – branch lengths optimized on fixed consensus topology Long branch species are problematic if tree is not fixed. Images coutesy of University of Nebraska, Dept.of Entomology. http://entomology.unl.edu/images/
protein tree – branch lengths optimized on fixed consensus topology Same species are on long branches in proteins as in RNAs Images coutesy of University of Nebraska, Dept.of Entomology. http://entomology.unl.edu/images/
Relative rate test for sequence evolution - Templeton Three aligned sequences with 0 known to be the outgroup. Test whether rates of evolution in branch 1 and branch 2 are equal. m1 = number of sites where 0 and 2 are the same and 1 is different. m2 = number of sites where 0 and 1 are the same and 2 is different. 0 1 2 Calculate: Should follow a chi squared distribution with one degree of freedom. Many pairs of related species found to have different rates in the mitochondrial sequences.
Limulus and the fruit fly, Drosophila, differ by a single translocation of a tRNA-Leu gene (shown in yellow and marked by an arrow). Limulus and the fruit fly, Drosophila, differ by a single translocation of a tRNA-Leu gene (shown in yellow and marked by an arrow). Limulus and the fruit fly, Drosophila, differ by a single translocation of a tRNA-Leu gene (shown in yellow and marked by an arrow). Gene Order sometimes gives evidence of phylogenetic relationships The gene order of the ancestral arthropod is thought to be the same as that of the horseshoe crab Limulus. Image courtesy of Marine Biology Lab, Woods Hole. www.mbl.edu/animals/Limulus The same translocation of tRNA-Leu is found in insects and crustaceans but not myriapods and chelicerates. Strong argument for the group Pancrustacea (= insects plus crustaceans) Limulus and the fruit fly, Drosophila, differ by a single translocation of a tRNA-Leu gene (shown in yellow and marked by an arrow).
Moderately rearranged Completely scrambled
Very High High Species ranked according to breakpoint distance from ancestor. Medium Low
R =0.99 R =0.59 R =0.53 R =0.69
Highly rearranged genomes have highly divergent sequences. Rates of sequence evolution and genome rearrangement are correlated. Both are very non-clocklike. There are many species where only tRNAs have changed position. Species with highly reshuffled tRNAs have high rates of sequence evolution in both tRNAs and proteins.
Relative rate of genome rearrangement (Xu et al 2006) Three gene orders with 0 known to be the outgroup. Test whether rates of rearrangement in branch 1 and branch 2 are equal. n1 = number of gene couples in 0 and 2 but not in 1 – i.e. New breakpoint in 1 n2 = number of gene couples in 0 and 1 but not in 2 – i.e. New breakpoint in 2 0 1 2 Calculate: Should follow a chi squared distribution with one degree of freedom. We took pairs where there was a significant difference in rearrangement rates (χn2 was large) and showed that there was a significant difference in substitution rates too (χm2 was large).
Good Guys Bad Guys Gene order is sometimes a strong phylogenetic marker but the Bad Guys are problematic in gene order analysis as well as phylogenetics. Why does the evolutionary rate speed up in these isolated groups of species? Why to tRNA genes move more frequently? What are the relative rates of inversion and translocation? Credits: Daniel Jameson/ Bin Tang – Database design and management Daniel Urbina – Base and Amino Acid Frequencies Wei Xu – Gene Order Analysis and Arthropod Phylogenies