Download
1 / 1
10 likes | 89 Views
(a). (b). (a). (b). (c). (c). (a). (a). (b). (b). (d). (e). (f). (d). (e). (c). (c). (d). (d). (e). (e). (a). (b). (a). (b). (c). Table: Varying parameters for Hydrolight simulations. (a) Cloud index: 0%, 20%, 40%, 60%, 80%, 100% Solar angle: fixed at 17.85%

E N D
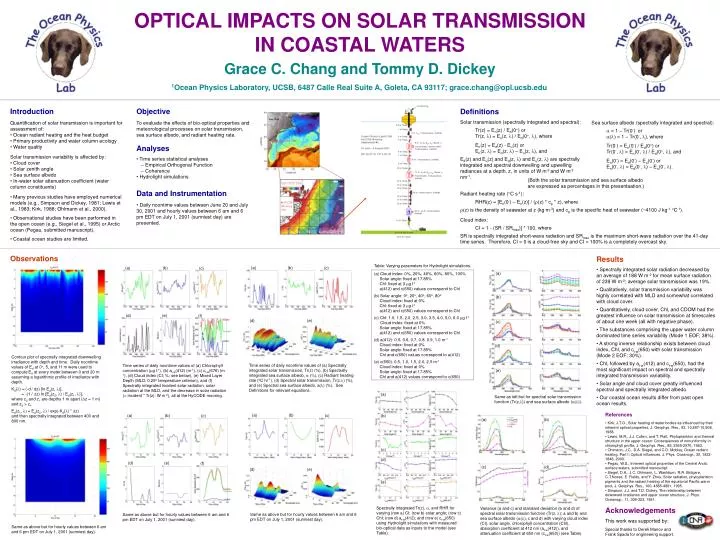
(a) (b) (a) (b) (c) (c) (a) (a) (b) (b) (d) (e) (f) (d) (e) (c) (c) (d) (d) (e) (e) (a) (b) (a) (b) (c) Table: Varying parameters for Hydrolight simulations. (a) Cloud index: 0%, 20%, 40%, 60%, 80%, 100% Solar angle: fixed at 17.85% Chl: fixed at 3 mg l-1 a(412) and c(650) values correspond to Chl (b) Solar angle: 0o, 20o, 40o, 60o, 80o Cloud index: fixed at 0% Chl: fixed at 3 mg l-1 a(412) and c(650) values correspond to Chl (c) Chl: 1.0, 1.5, 2.0, 2.5, 3.0, 3.5, 4.0, 5.0, 6.0 mg l-1 Cloud index: fixed at 0% Solar angle: fixed at 17.85% a(412) and c(650) values correspond to Chl (d) a(412): 0.5, 0.6, 0.7, 0.8, 0.9, 1.0 m-1 Cloud index: fixed at 0% Solar angle: fixed at 17.85% Chl and c(650) values correspond to a(412) (e) c(650): 0.5, 1.0, 1.5, 2.0, 2.5 m-1 Cloud index: fixed at 0% Solar angle: fixed at 17.85% Chl and a(412) values correspond to c(650) (a) (b) (c) (c) (d) (d) (e) (d) (e) (f) Acknowledgements This work was supported by: Special thanks to Derek Manov and Frank Spada for engineering support. OPTICAL IMPACTS ON SOLAR TRANSMISSION IN COASTAL WATERS Grace C. Chang and Tommy D. Dickey 1Ocean Physics Laboratory, UCSB, 6487 Calle Real Suite A, Goleta, CA 93117; grace.chang@opl.ucsb.edu • Introduction • Quantification of solar transmission is important for assessment of: • Ocean radiant heating and the heat budget • Primary productivity and water column ecology • Water quality • Solar transmission variability is affected by: • Cloud cover • Solar zenith angle • Sea surface albedo • In-water solar attenuation coefficient (water column constituents) • Many previous studies have employed numerical models (e.g., Simpson and Dickey, 1981; Lewis et al., 1983; Kirk, 1988; Ohlmann et al., 2000). • Observational studies have been performed in the open ocean (e.g., Siegel et al., 1995) or Arctic ocean (Pegau, submitted manuscript). • Coastal ocean studies are limited. • Objective • To evaluate the effects of bio-optical properties and meteorological processes on solar transmission, sea surface albedo, and radiant heating rate. • Analyses • Time series statistical analyses • -- Empirical Orthogonal Function • -- Coherence • Hydrolight simulations • Data and Instrumentation • Daily noontime values between June 20 and July 30, 2001 and hourly values between 6 am and 6 pm EDT on July 1, 2001 (sunniest day) are presented. Definitions Solar transmission (spectrally integrated and spectral): Tr(z) = En(z) / Ed(0+) or Tr(z, l) = En(z, l) / Ed(0+, l), where En(z) = Ed(z) - Eu(z) or En(z, l) = Ed(z, l) – Eu(z, l), and Ed(z) and Eu(z) and Ed(z, l) and Eu(z, l) are spectrally integrated and spectral downwelling and upwelling radiances at a depth, z, in units of W m-2 and W m-2 nm-1. Sea surface albedo (spectrally integrated and spectral): a = 1 – Tr(0-) or a(l) = 1 – Tr(0-, l), where Tr(0-) = En(0-) / Ed(0+) or Tr(0-, l) = En(0-, l) / Ed(0+, l), and En(0-) = Ed(0-) – Eu(0-) or En(0-, l) = Ed(0-, l) – Eu(0-, l). (Both the solar transmission and sea surface albedo are expressed as percentages in this presentaation.) Radiant heating rate (°C s-1): RHR(z) = [En(0-) – En(z)] / (r(z) * cp * z), where r(z) is the density of seawater at z (kg m-3) and cp is the specific heat of seawater (~4100 J kg-1 °C-1). Cloud index: CI = 1 - (SR / SRmax)] * 100, where SR is spectrally integrated short-wave radiation and SRmax is the maximum short-wave radiation over the 41-day time series. Therefore, CI = 0 is a cloud-free sky and CI = 100% is a completely overcast sky. Observations • Results • Spectrally integrated solar radiation decreased by an average of 188 W m-2 for mean surface radiation of 239 W m-2; average solar transmission was 19%. • Qualitatively, solar transmission variability was highly correlated with MLD and somewhat correlated with cloud cover. • Quantitatively, cloud cover, Chl, and CDOM had the greatest influence on solar transmission at timescales of about one week (all with negative phase). • The substances comprising the upper water column dominated time series variability (Mode 1 EOF; 38%). • A strong inverse relationship exists between cloud index, Chl, and ct-w(650) with solar transmission (Mode 2 EOF; 30%). • Chl, followed by at-w(412) and ct-w(650), had the most significant impact on spectral and spectrally integrated transmission variability. • Solar angle and cloud cover greatly influenced spectral and spectrally integrated albedo. • Our coastal ocean results differ from past open ocean results. Contour plot of spectrally integrated downwelling irradiance with depth and time. Daily noontime values of Ed at 0+, 5, and 11 m were used to compute Ed at every meter between 0 and 20 m assuming a logarithmic profile of irradiance with depth. Kd(l) = (-d / dz) [ln Ed(z, l)], = -(1 / Dz) ln [Ed(z2, l) / Ed(z1, l)], where z2 and z1 are depths 1 m apart (Dz = 1 m) and z2 > z1. Ed(z1, l) = Ed(z2, l) / exp(-Kd(l) * Dz) and then spectrally integrated between 400 and 800 nm. Time series of daily noontime values of (a) Spectrally integrated solar transmission, Tr(z) (%), (b) Spectrally integrated sea surface albedo, a (%), (c) Radiant heating rate (oC hr-1), (d) Spectral solar transmission, Tr(z,l) (%), and (e) Spectral sea surface albedo, a(l) (%). See Definitions for relevant equations. Time series of daily noontime values of (a) Chlorophyll concentration (mg l-1), (b) at-w(412) (m-1), (c) ct-w(676) (m-1), (d) Cloud index (CI; %; see below), (e) Mixed Layer Depth (MLD; 0.25o temperature criterion), and (f) Spectrally integrated Incident solar radiation, solar radiation at the MLD, and the decrease in solar radiation (= incident * Tr(z); W m-2), all at the HyCODE mooring. Same as left but for spectral solar transmission function (Tr(z,l)) and sea surface albedo (a(l)). • References • Kirk, J.T.O., Solar heating of water bodies as influenced by their inherent optical properties, J. Geophys. Res., 93, 10,897-10,908, 1988. • Lewis, M.R., J.J. Cullen, and T. Platt, Phytoplankton and thermal structure in the upper ocean: Consequences of nonuniformity in chlorophyll profile, J. Geophys. Res., 88, 2565-2570, 1983. • Ohlmann, J.C., D.A. Siegel, and C.D. Mobley, Ocean radiant heating. Part I: Optical influences, J. Phys. Oceanogr., 30, 1833-1848, 2000. • Pegau, W.S., Inherent optical properties of the Central Arctic surface waters, submitted manuscript. • Siegel, D.A., J.C. Ohlmann, L. Washburn, R.R. Bidigare, C.T.Nosse, E. Fields, and Y. Zhou, Solar radiation, phytoplankton pigments and the radiant heating of the equatorial Pacific warm pool, J. Geophys. Res., 100, 4885-4891, 1995. • Simpson, J.J. and T.D. Dickey, The relationship between downward irradiance and upper ocean structure, J. Phys. Oceanogr., 11, 309-323, 1981. Spectrally integrated Tr(z), a, and RHR for varying (row a) CI; (row b) solar angle; (row c) Chl; (row d) at-w(412); and (row e) ct-w(650) using Hydrolight simulations with measured bio-optical data as inputs to the model (see Table). Variance (a and c) and standard deviation (b and d) of spectral solar transmission function (Tr(z, l); a and b) and sea surface albedo (a(l); c and d) with varying cloud index (CI), solar angle, chlorophyll concentration (Chl), absorption coefficient at 412 nm (at-w(412)), and attenuation coefficient at 650 nm (ct-w(650)) (see Table). Same as above but for hourly values between 6 am and 6 pm EDT on July 1, 2001 (sunniest day). Same as above but for hourly values between 6 am and 6 pm EDT on July 1, 2001 (sunniest day). Same as above but for hourly values between 6 am and 6 pm EDT on July 1, 2001 (sunniest day).