Download
1 / 26
260 likes | 458 Views
Characterizing Usage in Wireless Networks: Outline. Introduction Motivation Campus-wide usage study Corporate mobility and usage study Summary. Characterizing Usage in Wireless Networks. Understand user’s behavior mobility Utilization of APs Applications used in wireless networks

E N D
Characterizing Usage in Wireless Networks: Outline • Introduction • Motivation • Campus-wide usage study • Corporate mobility and usage study • Summary
Characterizing Usage in Wireless Networks • Understand user’s behavior • mobility • Utilization of APs • Applications used in wireless networks • www, VoIP, p2p application, streaming media • Wireless devices used
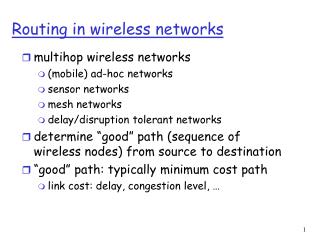
Why important? • Characterizing wireless use is important • Providers: provision the network • Designers: standard features for high-throughput • Software developers: wireless-aware applications • Changes in usage is expected • New wireless devices: PDAs, printers, audio players • New applications: real-time multimedia
Tristan Henderson, David Kotz, Ilya Abyzov Dartmouth College The Changing Usage of a Mature Campus-wide Wireless Network
Campus-wide usage study • Extensive data collection at Dartmouth college over 17 weeks • November 2003 – February 2004 • 190 buildings on 200 acres • 5500 students / 1200 faculty • 3200 – 3300 undergraduate students • required to own a computer (97% laptops)
Extensive data set collections • 4 sources of data consisting of over • 32 million syslog messages (1 sec resolution) • 16 million SNMP polls (5 min interval) • 4.6 TB of packets sniffed • 5.16 GB Call detail records (CDRs) for VoIP
Data decomposition and analysis • Main goal: Understand user's behavior
Client usage trends from 2001 to 2004 • Behaviors that remain the same • Usage is still diurnal • Same proportion of heavy users • Same busiest buildings • Behaviors that have changed • # of cards increased linearly • Roaming increased • AP utilization increased
AP utilization trends Fall/Winter 2003/4 Fall 2001 Avg = 76.4% Avg = 66.4% Approx 2.5x increase
Traffic trends from 2001 to 2004 • Traffic behavior changes • Overall traffic increased by approximately 3x • Applications changed • Destination reversal (now more on-campus traffic) • Traffic behavior constants • Residences generate the most traffic
Application changes • Reported proportions • www decreased from 62.9% to 28.6% • P2P increased from 5.2% to 19.3% • filesystems increased from 5.3% to 21.5% • streaming increased from 0.9% to 4.6% Fall/Winter 2003/4 Fall 2001
Specific applications: VoIP trends • VoIP usage behaviors • Usage is diurnal • Number of devices does not grow much • Users made short calls • Wireless users made few calls median call: 42 sec median wireless: 31 sec
Specific applications: P2P trends • Files were downloaded and uploaded • Traffic was predominantly internal (72.7%) • Few users responsible for most traffic • 147 cards (2%) saw over 1MB traffic • 10 cards (6.8% of the 2%) saw over 50% of recorded traffic
Specific applications: streaming trends • Most streaming was inbound • Outbound itunes traffic represent music sharing • Most traffic was within campus (79.6%) • Streaming for teaching purposes produces large files
Mobility trends: Users are not very mobile 50% of users spent 98.7% of time at home especially in residential, academic, and administration buildings Higher than Castro paper 50% of users spent nearly 10 min at single AP Longer than Castro paper
Magdalena Balazinska – MIT Paul Castro – IBM Research Characterizing Mobility and Network Usage in a Corporate Wireless Local-Area Network
Goal of the paper • Previous studies analyze usage of wireless networks in: • University Building (Tang and Baker) • University Campus (Kotz and Essien) • Large Auditorium (Balachandran et al.) • Metropolitan area network (Tang and Baker) • Evaluate results from data collected in a Corporate Wireless Local-area Network • Focus: Population characteristics, load distribution across APs, users level of activity, user mobility
Experiment Data • Three Corporate buildings • One Large (LBldg): 131 AP, ~10 miles away from the other two buildings • One Medium (MBldg): 36 AP • One Small (SBldg): 10 AP • MBldg and SBldg are adjacent • Topology: 1 AP per corridor, extra in highly used rooms (i.e. customer lab in SBldg) • Number of users = Number of MAC addresses • Data collected every 5 minutes, for 30 days, using SNMP
Population characteristics • 1366 distinct users seen: 796 mainly in LBldg, 437 in MBldg, 133 in SBldg • Similar results to working campus locations, different from dormitories or metropolitan networks • Patterns in the population reflect patterns in n. of users
Utilization of APs • Good coverage implies partial usage of APs
Users and load • AP throughput: amount of bytes that an access point forwards for any user in either direction in a given period of time • Number of users and load of a specific AP are weakly dependent
Mobility characteristics • Few users visit all three buildings • Different mobility among users • Most of the time spent at one (home) location • Users have higher activity on guest locations
Prevalence • Prevalence: amount of time a user spends with a given AP Prevalence distribution Prevalence matrix
Prevalence • 5 categories of users: Highly mobile, Somewhat Mobile, Regular, Occasionally Mobile, Stationary
Persistence • Persistence: amount of time a user that a user stay associated w/ an AP before moving to another AP
Summary • Usage characterization • Number of wireless cards; utilization of APs • Specific applications • VoIP, P2P, streaming media • Mobility • Prevalence, persistence • Work is on-going • Dartmouth currently • upgrading to 802.11a/b/g • migrating cable TV to IP-based • Analyze the effects of worms on WLAN