Download
1 / 29
290 likes | 367 Views
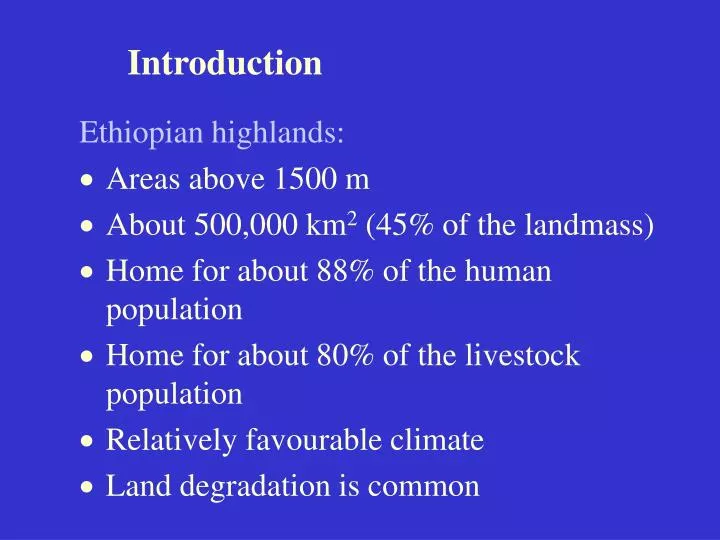
Introduction. Ethiopian highlands: · Areas above 1500 m · About 500,000 km 2 (45% of the landmass) Home for about 88% of the human population Home for about 80% of the livestock population Relatively favourable climate Land degradation is common.

E N D
Introduction • Ethiopian highlands: • · Areas above 1500 m • · About 500,000 km2 (45% of the landmass) • Home for about 88% of the human population • Home for about 80% of the livestock population • Relatively favourable climate • Land degradation is common
Reflections of the severity of land degradation • ·Decrease in area cultivated • · Reduced crop yield/ha • 1.2 ton for cereals • 0.6 tons for pulses • 0.5 tons for oil crops • · Low livestock productivity • 1-2 litres of milk/day • Low weight gains and • Low draught power output • Cumulative effects: • Produce not sufficient to cover annual consumption • Cyclic poverty and famine
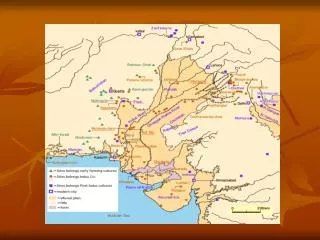
The Study area • High human and livestock population • Loss of vegetative cover • Steep slope cultivation • Land degradation • Flooding of bottomlands • Loss of farmlands due to gullying
Researcharea Lakes • Please insert map 1 here
Objectives of the study General • Identify major causes of LULC changes • Study the effect of land use land and cover changes • Analyse implications of such changes on human and livestock nutrition • Recommend appropriate interventions
Specific • Study long term land cover and land use changes around Yerer mountain • Study effects of long term land cover and land use changes on human and livestock nutrition • Quantify soil loss due to sheet erosion and area taken up by major gullies
Materials and Methods i. Materials • Socio-economic study • i.. Structured questionnaires • ii. Census data • iii. Data from different offices • b. Land cover and Land Use study • i. 1971/72 aerial photos (EMA) • ii. 2000 Landsat ETM+ imagery • iii. CSA wereda map with PA boundaries (CSA) • iv. Topographic map (EMA) • v. Scanner, Digitizer, GPS
ii. Methods • Socio-economic data • i. Random selection of sample farmers (132) • ii. SPSS software (Correlation, Duncan test)
b. Land cover and Land Use Landsat ETM+ 2000 1971/1972 Aerial Photo Scanning at 300 DPI Orthorectification Supervised Classification Land use/cover change
Results Socio-economic characteristics Table 2. Literacy level of sample household heads by sex and age group
Table 3. Food grain production, consumption (kg grain) and Kcal/person/day from different crops for sample households, mean of 3 years (2001-2003) 1 source: EHNRI
Land cover and land use Table 4. Land cover classes their corresponding area and change (1971/72 and 2000) 1 For 2000 this cover category refers to “dense shrubland with remnant Juniper trees”
+10453 ha -1435 ha Net grassland - 9388 Net cultivated + 9018 +2148 ha -11536 ha 10,034 ha 1281 ha 369 ha 28 ha 839 ha 50 ha 1236 ha 266 ha 65 ha 89 ha Net wet & water body +253 +331 ha -78 ha +1325 ha -1208 ha Net shrubland +117 Figure 2. Land use and land cover dynamics 1971/72 and 2000
Ethiopia: Generalized highland landscape a) Low population density/km2 Steep slope b) High population density/km2 •Deforestation •Overstocking food/feed shortage •Soil erosion Moderate slope •Low fertility •Waterlogging Flat land/ plateau •Expansion of cropping •Soil erosion •Overstocking food/feed shortag Valleys Courtesy: Kinde Engida
Table 5. Estimated yearly dry matter obtainable from different crop residues for the sample farmers
Table 6. Daily and annual DM requirement for MEm and 20% production for animals, by livestock type for the study area 1 Source: Berhanu Gebremedhin (2004)
Table 7. Estimated yearly feed (DM) obtainable from different land cover types for the whole study area, based on 2000 imagery 1 DM from crop residue 2 Source: Woody Biomass Inventory and Strategic planning Project
Table 8. Mean annual household energy consumption for different domestic uses as reported by sample farmers
Table 9. Potential woody biomass for the study area (2000) 1 Source: Woody Biomass Inventory and Strategic planning Project
Table 26. Total area, length, maximum width and depth of two big gullies in the study area
Conclusion • There is very high illiteracy level in the area • Family size and population in general are very high • Daily minimum calorific requirements are not met • Livestock carrying capacity is surpassed • Crop residue is the major source of feed • Bio-fuels are the major source of energy, of which cow dung is a major source • Cultivated land increased by 125% in three decades, mainly at the cost of grasslands • Erosion rates were higher in 2000 than 1971/72 • Population is the major driving force to these changes
Recommendations • Increased access to primary school education required • Education on family planning is strongly recommended • Giving land use rights to individuals will encourage better NRM • Improvement of non-timber products • Early planting for reducing erosion hazards • Soil and water management in some areas required • Convince communities to stop cultivating areas above 30% slope • Diversification of crops should be encouraged • Forage improvement (indigenous and exotic) should be more encouraged • Better livestock management systems (example tethering) should be practised • Alternative energy resourcesare required