Download
1 / 4
50 likes | 58 Views
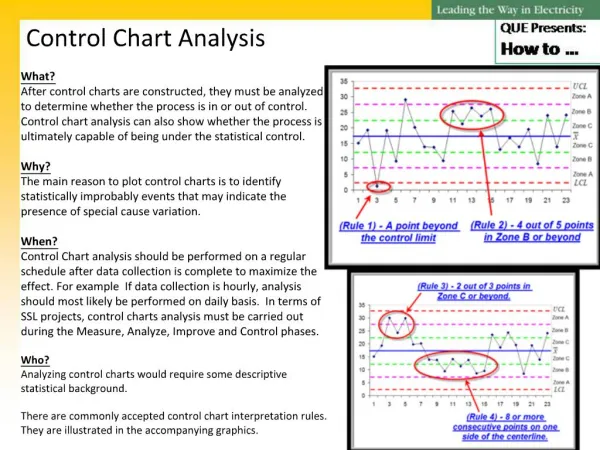
T20-04 C Chart Control Limit Calculations. Purpose Allows the analyst to calculate the defectives per unit "C-Chart" 3-sigma control limits. Inputs Average Defective Per Unit (Chat) Outputs C (Defects Per Unit) Control Chart LCL & UCL. Standard Error.

E N D
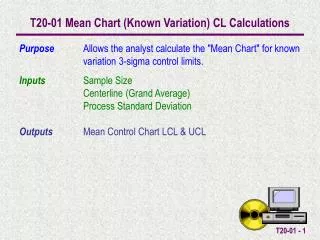
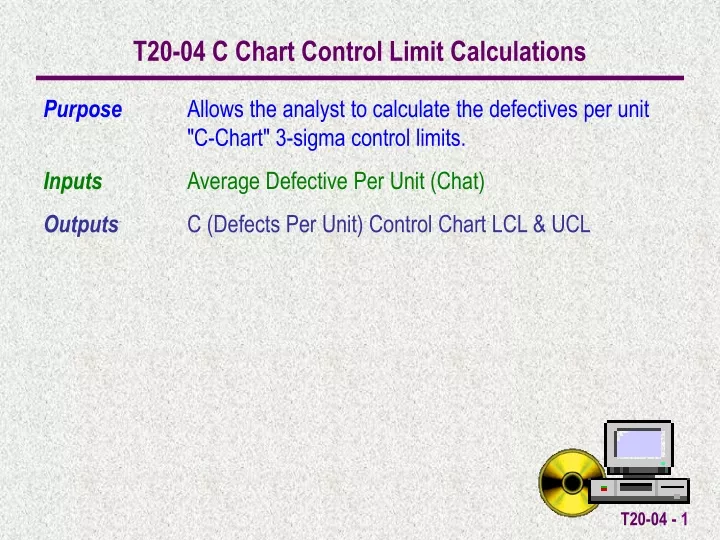
T20-04 C Chart Control Limit Calculations Purpose Allows the analyst to calculate the defectives per unit "C-Chart" 3-sigma control limits. Inputs Average Defective Per Unit (Chat) Outputs C (Defects Per Unit) Control Chart LCL & UCL
Standard Error In the event c is unknown, it can be estimated by sampling and computing the average defects observed. In this case the average can be substituted in the formula for . Also, note that since the formula is an approximation the LCL can be negative. In these cases the LCL is set to 0. C-Chart (Defects Per Unit) The C-Chart is used to monitor the number of defects per unit (e.g. automobiles, hotel rooms, typed pages, rolls of carpet). The C Chart Centerline, UCL and LCL are calculated by the following formula.
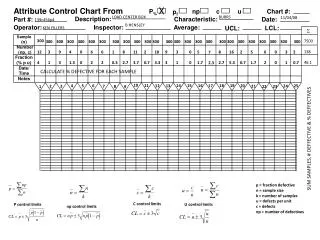
Example Rolls of coiled wire are monitored using a c-chart. Eighteen rolls of wire have been examined and the number of defects per roll has been recorded in the data provided here. The average defective per roll (Chat) can now be calculated. This can be done by using the Descriptive Statistics Template or more quickly by using the EXCEL built inAVERAGEfunction on this set of numbers. Calculate the Control Limits for the C Control Chart. Average Defects per Roll
The LCL, UCL are automatically calculated Input the Average Defective Per Unit (Chat) in the light green cells.