Download
1 / 43
470 likes | 531 Views
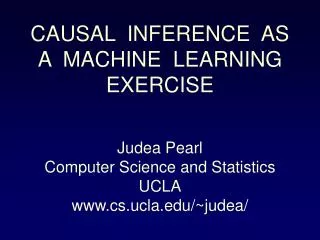
THE FOUNDATIONS OF CAUSAL INFERENCE With Reflections on Machine Learning and Artificial Intelligence. Judea Pearl UCLA WHY-19 Symposium Stanford, 2019. OUTLINE. Why we need a new logic to answer causal questions Why AI needs a new engine to operationalize the new logic

E N D
THE FOUNDATIONS OF CAUSAL INFERENCE With Reflections on Machine Learning and Artificial Intelligence Judea Pearl UCLA WHY-19 Symposium Stanford, 2019
OUTLINE • Why we need a new logic to answer causal questions • Why AI needs a new engine to operationalize the new logic • The fundamental laws ("double-helix") of causal inference • The Seven Pillars of Causal Wisdom (The tools of causal inference and how they impact several sciences)
CAUSAL MODELS AND THE COGNITIVE REVOLUTION • 10,000 years ago, human beings accounted for less than a tenth of 1 percent of all vertebrate life on planet Earth. • Today, that percentage, including livestock and pets, is in the neighborhood of 98! • (Daniel Dennett, 2006) • What Happened? • What computational facility did humans acquire 10,000 years ago that they did not possess before?
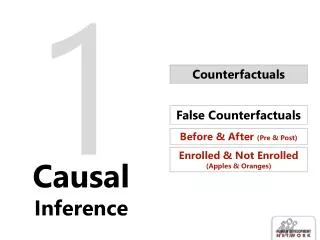
COUNTERFACTUALS: THE HOMOSAPIENS’ SECRET
THE INVENTION OF COUNTERFACTUALS • About 70,000 years ago, Sapiens from East Africa spread into the Arabian peninsula, and from there they quickly overran the entire Eurasian landmass, wiping out the native population. • What was the Sapiens' secret of success? • (Harari, 2015) • The ability to imagine things that do not really exist. • You could never convince a monkey to give you a banana by promising him limitless bananas after death in monkey heaven.
TYPICAL CAUSAL QUESTIONS How effective is a given treatment in preventing a disease? Was it the new tax break that caused our sales to go up? Or our marketing campaign? What is the annual health-care costs attributed to obesity? Can hiring records prove an employer guilty of sex discrimination? I am about to quit my job, will I regret it? I am about to meet another robot, will I regret it? * Unarticulatable in the standard grammar of science.
3-LEVEL HIERARCHY COUNTERFACTUALS ACTIVITY: Imagining, Retrospection, Understanding QUESTIONS: What if I had done . . . ? Why? (Was it X that caused Y? What if X had not occurred? What if I had acted differently?) EXAMPLES: Was it the aspirin that stopped my headache? Would Kennedy be alive if Oswald had not killed him? What if I had not smoked the last 2 years? • INTERVENTION • ACTIVITY: Doing, Intervening • QUESTIONS: What if I do . . . ? How? • (What would Y be if I do X?) • EXAMPLES: If I take aspirin, will my headache be cured? • What if we ban cigarettes? • ASSOCIATION • ACTIVITY: Seeing, Observing • QUESTIONS: What if I see . . . ? • (How would seeing X change my belief in Y?) • EXAMPLES: What does a symptom tell me about a disease? • What does a survey tell us about the election results?
WHY THE LOGIC OF ASSOCIATION IS INSUFFICIENT Exercise is helpful in every age group but harmful for a typical person. Why not?
WHY THE LOGIC OF ASSOCIATION IS INSUFFICIENT Exercise is helpful in every age group but harmful for a typical person. Is exercise helpful or not?
WHY THE LOGIC OF ASSOCIATION IS INSUFFICIENT Exercise is helpful in every age group but harmful for a typical person. Is exercise helpful or not? More specific? What about seatbelt usage?
THE SEVEN PILLARS OF CAUSAL WISDOM Pillar 1: Graphical models for prediction and diagnosis Pillar 2: Deconfounding policy analysis Pillar 3: Algorithmitization of counterfactuals Pillar 4: Mediation analysis and the assessment of direct and indirect effects Pillar 5: External validity and sample selection bias Pillar 6: Missing data Pillar 7: Causal discovery
PILLAR 1: GRAPHICAL MODELS FOR PREDICTION AND DIAGNOSIS • In the 1980's graphs and probabilities came together to create a machine for revising beliefs in light of new evidence. • Bayesian Networks captured probabilistic knowledge in graphical form and permitted updating by message passing. • Gift of the Gods: • The axioms of conditional independence and the • axioms of graph separation share a common core. • d-separation: If we find all paths from X to Y intercepted by vertices of set Z, we can conclude that X is independent of Y conditioned on Z. (The alpha-bet of causal modeling)
READING INDEPENDENCIES Graph (G) Model (M) C (Climate) S (Sprinkler) R (Rain) W (Wetness) Miracles do happen If the U 's are independent, the observed distribution P(C,R,S,W) satisfies constraints that are: (1) independent of the f 's and of P(U), (2) readable from the graph.
READING INDEPENDENCIES (Cont) Graph (G) Model (M) C (Climate) S (Sprinkler) R (Rain) W (Wetness) Every missing arrow advertises an independency, conditional on a separating set. • Applications: • Model testing • Structure learning • Reducing scientific questions to adjustments • Reducing scientific questions to symbolic calculus
PILLAR 2: POLICY ANALYSIS DECONFOUNDED Problem: Determine if effects of a given policy/action can be estimated from data and how. Solution: Demystified and reduced to a game • “back-door” – adjustment for covariates • “front door” – extends it beyond adjustment • do-calculus – predicts the effect of policy interventions whenever feasible
THE SECRET TO CAUSAL REASONING DISTINGUISH SEEING FROM DOING SEE DO =ON What if we see the Sprinkler ON? What if we turn the Sprinkler ON? What if the Sprinkler were ON? • Actions can be simulated analytically by “blocking backdoor paths” = adjustment 3 steps to counterfactuals
IDENTIFICATION REDUCED TO CALCULUS (THE ENGINE AT WORK) Genotype (Unobserved) Query Smoking Tar Cancer Probability Axioms Rule 2 Rule 2 Rule 3 Probability Axioms Rule 2 Rule 3 Estimand
PILLAR 3: THE ALGORITHMIZATION OF COUNTERFACTUALS Task: Given {Model + Data}, determine what Joe's salary would be, had he had one more year of education. Solution: The probability of every counterfactual can be computed or bounded using the "surgery" procedure. Corollary: "Causes of effects" and "Attribution" formalized.
ATTRIBUTION • Your Honor! My client (Mr. A) died BECAUSE • he used this drug.
ATTRIBUTION • Your Honor! My client (Mr. A) died BECAUSE • he used this drug. • Court to decide if it is MORE PROBABLE THAN • NOT that Mr. A would be alive BUT FOR the drug!
WITH PROBABILITY ONE CAN FREQUENCY DATA DETERMINE LIABILITY? Sometimes: When PN is bounded above 0.50. • Combined data tell more that each study alone
U Y X Z X Z Y FORMULATING A PROBLEM IN THREE LANGUAGES • English: Given samples from P(x, y, z) • Find: Effect of Smoking on Cancer (Genotypes) Mental model (Tar) (Cancer) (Smoking) 2. Structural: Find: P(Y = y | do(X = x)) U
U Y X Z FORMULATING A PROBLEM IN THREE LANGUAGES • English: Given samples from P(x, y, z) • Find: Effect of Smoking on Cancer (Genotypes) Mental model (Tar) (Cancer) (Smoking) 3. Potential Outcome: Find: P(Yx = y) Not too friendly: Consistent?, complete?, redundant?, plausible?, testable?
PILLAR 4: MEDIATION ANALYSIS – DIRECT AND INDIRECT EFFECTS Task: Given {Data + Model}, unveil and quantify the mechanisms that transmit changes from a cause to its effects. Result: The graphical representation of counterfactuals tells us when direct and indirect effects are estimable from data, and, if so, how necessary (or sufficient) mediation is for the effect.
LEGAL IMPLICATIONS OF DIRECT EFFECT Can data prove an employer guilty of hiring discrimination? X M (Gender) (Qualifications) Y (Hiring) What is the direct effect of X on Y ? (m-dependent) Adjust for M? No! No! CDE Identification is completely solved
LEGAL DEFINITION OF DISCRIMINATION Can data prove an employer guilty of hiring discrimination? X M (Gender) (Qualifications) Y (Hiring) The Legal Definition: Find the probability that “the employer would have acted differently had the employee been of different sex and qualification had been the same.”
NATURAL INTERPRETATION OF AVERAGE DIRECT EFFECTS Robins and Greenland (1992), Pearl (2001) X M m = f (x, u) y = g (x, m, u) Y Natural Direct Effect of X on Y: The expected change in Y, when we change X from x0 to x1 and, for each u, we keep M constant at whatever value it attained before the change. Note the nested counterfactuals
PILLAR 5: TRANSFER LEARNING, EXTERNAL VALIDITY, AND SAMPLE SELECTION BIAS • Science is all about generalization "what works here would also work elsewhere" • Preserve commonalities and discard diversity • Causation = the management of invariants
PILLAR 5: TRANSFER LEARNING, EXTERNAL VALIDITY, AND SAMPLE SELECTION BIAS Task: A machine trained in one environment finds that environmental conditions changed. When/how can it amortize past learning to the new environment? Solution: Complete formal solution obtained through the do-calculus and “selection diagrams” (Bareinboim et al., 2016)
APPLICATION: GENERALIZABILITY AND DATA FUSION • The problem • How to combine results of several experimental and observational studies, each conducted on a different population and under a different set of conditions, • so as to construct a valid estimate of effect size in yet a new population, unmatched by any of those studied.
THE PROBLEM IN REAL LIFE Target population Query of interest: Q = P*(y | do(x)) • Los Angeles • Survey data • Younger population • Arkansas • Survey data available • New York • Survey data • Resembling target • Boston • Age not recorded • Mostly successful lawyers • Texas • Mostly Spanish subjects • High attrition (e) San Francisco High post-treatment blood pressure • Toronto • Randomized trial • College students (i) Wyoming RCT, young athletes • Utah • RCT, paid volunteers, unemployed
THE PROBLEM IN MATHEMATICS Target population Query of interest: Q = P*(y | do(x)) S (a) (b) (c) Z Z Z X W Y X W Y X W Y (d) (e) (f) Z Z Z S S X W Y X W Y X W Y (g) (h) (i) Z Z Z S S X W Y X W Y X W Y
PILLAR 6: MISSING DATA (Mohan, 2017) Problem: Given data corrupted by missing values and a model of what causes missingness. Determine when relations of interest can be estimated consistently “as if no data were missing.” Results: Graphical criteria unveil when estimability is possible, when it is not, and how.
MISSING DATA: A STATISTICAL PROBLEM TURNED CAUSAL Question: Is there a consistent estimator of P(X,Y,Z)? Is P(X,Y,Z) estimable (asymptotically) as if no data were missing?
MISSING DATA: A STATISTICAL PROBLEM TURNED CAUSAL Question: Is there a consistent estimator of P(X,Y,Z)? Is P(X,Y,Z) estimable (asymptotically) as if no data were missing? Answers: There is no Model-blind estimator, but, Given a missingness model, we can tell you yes/no, and how. Given a missingness model, we can tell you whether or not it has testable implications.
SMART ESTIMATION OF P(X,Y,Z) Example 1: Is P(X,Y,Z) estimable? X Z Y Ry Rx= 0 ⇒ Xobserved Rx= 1 ⇒ Xmissing = Rz Rx
SMART ESTIMATION OF P(X,Y,Z) Example 1: Is P(X,Y,Z) estimable? X Z Y Ry Rx= 0 ⇒ Xobserved Rx= 1 ⇒ Xmissing Rz Rx Testable implications:
SUMMARY: MISSING DATA Results: Causal models unveil (1) when estimability is possible, (2) how, (3) when it is not, (4) when model-blind estimators can do it, and (5) when they cannot. Corollary: Only by taking models seriously we can learn when they are not needed.
PILLAR 7: CAUSAL DISCOVERY Task: Search for a set of models (graphs) that are compatible with the data, and represent them compactly. Results: In certain circumstances, and under weak assumptions, causal queries can be estimated directly from this compatibility set. (Spirtes, Glymour and Scheines (2000); Jonas Peters etal (2018))
CONCLUSIONS “More has been learned about causal inference in the last few decades than the sum total of everything that had been learned about it in all prior recorded history.” (Gary King, Harvard, 2014) Data science is the science of interpreting reality, not of summarizing data. The peak of the revolution is still ahead of us – e.g., automated scientists, social intelligence, free will and more.
Paper available: http://ftp.cs.ucla.edu/pub/stat_ser/r475.pdf Refs: http://bayes.cs.ucla.edu/jp_home.html THANK YOU Joint work with: Elias Bareinboim Karthika Mohan Ilya Shpitser Jin Tian Many more . . .