Download
1 / 17
170 likes | 298 Views
Query Optimization. overview. Application Programmer (e.g., business analyst, Data architect). Application. Sophisticated Application Programmer (e.g., SAP admin). Query Processor. Indexes. Storage Subsystem. Concurrency Control. Recovery. DBA, Tuner. Operating System.

E N D
ApplicationProgrammer(e.g., business analyst, Data architect) Application SophisticatedApplicationProgrammer(e.g., SAP admin) QueryProcessor Indexes Storage Subsystem Concurrency Control Recovery DBA,Tuner Operating System Hardware[Processor(s), Disk(s), Memory]
Overview of query processing Catalog Manager Database Cost Model Statistics Query Optimizer Query Evaluator QEP Parsed Query Parser Plan Generator Plan cost Estimator High Level Query Query Result
Statistics and Catalogs • Need information about the relations and indexes involved. Catalogs typically contain at least: • # tuples (NTuples) and # pages (NPages) for each relation. • # distinct key values (NKeys) and NPages for each index. • Index height, low/high key values (Low/High) for each tree index. • Catalogs updated periodically. • Updating whenever data changes is too expensive; lots of approximation anyway, so slight inconsistency ok. • More detailed information (e.g., histograms of the values in some field) are sometimes stored.
An example of catalog table • Schema of a catalog table is also stored in the catalog table
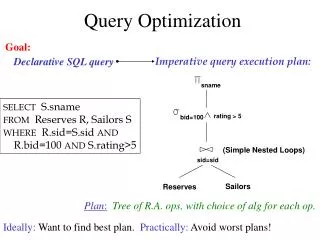
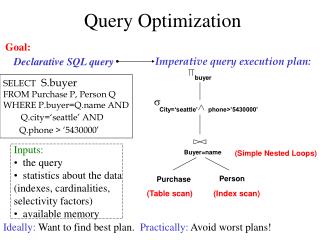
Overview of Query Optimization • Output of query optimization is QEP (Query evaluation plan) • QEP • Tree of Relational Algbra oprations, with access methods for each table and choice of algorithms for each operation. • Each operator typically implemented using a `pull’ interface: when an operator is `pulled’ for the next output tuples, it `pulls’ on its inputs and computes them. • Two main issues in query optimization: • For a given query, what plans are considered? • Algorithm to search plan space for cheapest (estimated) plan. • How is the cost of a plan estimated? • Ideally: Want to find best plan. Practically: Avoid worst plans! • We will study the System R approach.
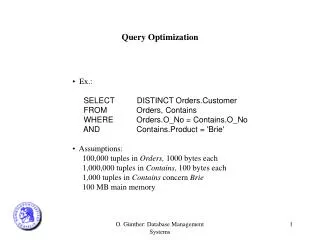
Example of QEP SELECT S.sname FROM Reserves R, Sailors S WHERE R.sid = S.sid AND R.bid = 100 AND S.rating > 5 • The query can be expressed in relational algebra as follows: • sname(bid=100^rating>5(Reserves∞sid=sidSailors)
Pipelined Evaluation • Pipelined vs Materialized • When a query is composed of several operators, the result of one operator is sometimes pipelined to another operator without creating a temporary relation to hold the intermediate result. • Intermediate results are produced, consumed, and discarded one page at a time • Otherwise, the tuples are materialized • Pipeline is preferred, since read and write overhead is omitted
Left-deep plan • Linear tree: at least one child is a base table • Left-deep tree: the right child of each join node is a base table • Busy tree • Left-deep plan can be fully-pipelined : all joins are evaluated using pipelining (inner table always be materialized because entire inner table needs to be examined) • Some join, e.g. hash join, sort-merge join can not be fully pipelined Left-deep tree Busy tree Linear tree Busy tree
Highlights of System R Optimizer • Impact: • Most widely used currently; works well for < 10 joins. • Cost estimation: Approximate art at best. • Statistics, maintained in system catalogs, used to estimate cost of operations and result sizes. • Considers combination of CPU and I/O costs. • Plan Space: Too large, must be pruned. • Only the space of left-deep plans is considered. • Left-deep plans allow output of each operator to be pipelined into the next operator without storing it in a temporary relation. • Cartesian products avoided.
Decomposing a query into blocks • A query block(or simply block) is a SQL query with no nesting and exactly one SELECT clause and one FROM clause and at most one WHERE clause, GROUP BY clause, and HAVING clause SELECT MAX (S2.rating) FROM Sailors S2 Nested block SELECT S.sid, MIN (R.day) FROM Sailors S, Reserves R, Boats B WHERE S.sid = R.sid AND R.bid = B.bid AND B.color = `red' AND S.rating = ( SELECT MAX (S2.rating) FROM Sailors S2 ) GROUP BY S.sid HAVING COUNT (*) > 1 SELECT S.sid, MIN (R.day) FROM Sailors S, Reserves R, Boats B WHERE S.sid = R.sid AND R.bid = B.bid AND B.color = `red' AND S.rating = Reference to nested block GROUP BY S.sid HAVING COUNT (*) > 1 Outer block
Query Blocks: Units of Optimization • An SQL query is parsed into a collection of query blocks, and these are optimized one block at a time. • Nested blocks are usually treated as calls to a subroutine, made once per outer tuple. (This is an oversimplification, but serves for now.) • For each block, the plans considered are: • All available access methods, for each reln in FROM clause. • All left-deep join trees (i.e., all ways to join the relations one at-a-time, with the inner reln in the FROM clause, considering all reln permutations and join methods.)
Estimating the cost of plans • The cost of a plan consist • The cost of performing the operation of a node in QEP • The size of the result of each node in QEP
Estimating the result sizes • Size =the product of the cardinalities of the relations in the FROM clause* reduction factors of where clause • Reduction factor: the ratio of the (expected) result size to the input size considering only the selection represented by the term SELECT attribute list FROM relation list WHERE term1^ term2^ : : : ^ termn
Simplified estimate • Column=value • 1/NKeys(I) • column1 = column2: • 1/MAX (NKeys(I1);NKeys(I2)) • column > value: • (High(I) − value)/(High(I) − Low(I)) • column IN (list of values): • the reduction factor for column = value multiplied by the number of items in the list • The assumption of above estimation: uniform data distribution
More accurate estimate • Uniform vs nonuiform distributions • Consider the relation with 45 tuples and the seletion age>13, using uniform assumption, 45*(1/15)=3; the real value is 9