Download
1 / 46
570 likes | 703 Views
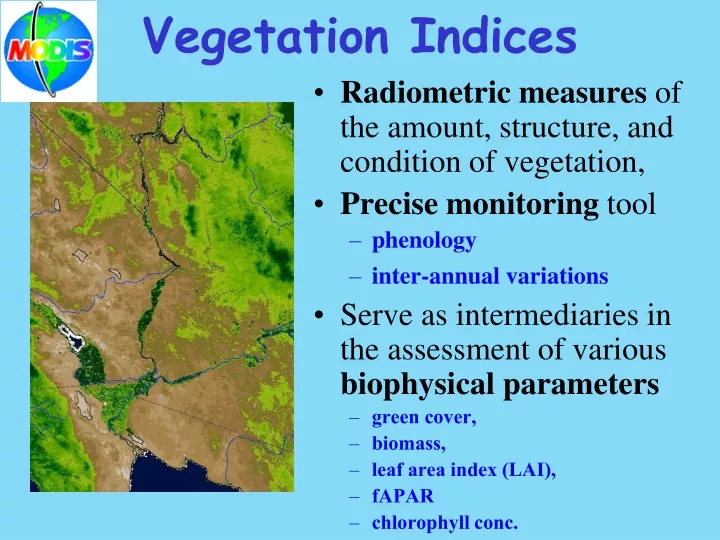
Vegetation Indices. Radiometric measures of the amount, structure, and condition of vegetation, Precise monitoring tool phenology inter-annual variations Serve as intermediaries in the assessment of various biophysical parameters green cover, biomass, leaf area index (LAI), fAPAR

E N D
Vegetation Indices • Radiometric measures of the amount, structure, and condition of vegetation, • Precise monitoring tool • phenology • inter-annual variations • Serve as intermediaries in the assessment of various biophysical parameters • green cover, • biomass, • leaf area index (LAI), • fAPAR • chlorophyll conc.
APPLICATIONS • Indicators of seasonal and inter-annual variations in vegetation (phenology) • Change detection studies (human/ climate) • Tool for monitoring and mapping vegetation • Serve as intermediaries is the assessment of various biophysical parameters: leaf area index (LAI), % green cover, biomass, FPAR, land cover classification
Atmospheric Influences on Spectral Response Functions Total Radiance Path Radiance Sunlight Reflected Energy Water vapor absorption Scattering by aerosols Skylight Atmosphere influences are not the same for Red and NIR
BIOPHYSICAL MEASURES Leaf Area Index (m2/m2): FPAR (Fraction of absorbed PAR): Incident Radiation Leaf Leaf Leaf Leaf Leaf Leaf Ground PAR absorption (radiometric) Leaf Area (structural)
Theoretical basis for spectral vegetation indices:
Collection 4 (Current re-processing) No aerosol correction Aerosol Correction from Collection 1 to Collection 4
Compositing Algorithm • Provide cloud-free VI product over set temporal intervals, • Reduce atmosphere variability & contamination • Minimize BRDF effects due to view and sun angle geometry variations • Depict and reconstruct phenological variations • Accurately discriminate inter-annual variations in vegetation. Physical and semi-empirical BRDF models Maximum VI (MVC) or constrained VI (CMVC)
Normalized Difference Vegetation Index (NDVI) • The NDVI is a normalized ratio of the NIR and red bands, • NDVI is a functionally equivalent to and is a non-linear transform of the simple ratio.
Reduces both atmosphere and canopy background contamination. Increased sensitivity at high biomass levels (less saturation) Linear Enhanced Vegetation Index (EVI) • rNIR - rred • EVI = • L + rNIR + C1 rred + C2 rblue • L = canopy background adjustment, • C1 and C2 are for aerosol correction and feedback • L=1, C1 and C2 are 6 and 7.5 • G = gain factor of 2.5 *G
NDVI EVI 1 km VI’s Tapajós ‘Forest’ Day 113 - 128 EVI NDVI
NDVI - Soil Sensitivity 1 0.9 LAI=2.7 0.8 0.7 LAI=1.6 0.6 0.5 NDVI LAI=1.1 0.4 0.3 0.2 LAI=0.5 0.1 Soil 0 0 0.05 0.1 0.15 0.2 0.25 0.3 0.35 0.4 Soil Albedo
Soil Adjusted Vegetation Index • SAVI isolines overlap vegetation isolines over a wide range of LAI values. • SAVI becomes insensitive to soil noise within this range of LAI • The perfect range depends on the choice of the ‘L’ value in the SAVI formulation.
Soil LAI=0.5 LAI=1.1 LAI=1.6 LAI=2.7 0.7 0.6 0.5 0.4 0.3 SAVI 0.2 0.1 0 0 0.05 0.1 0.15 0.2 0.25 0.3 0.35 0.4 Soil Albedo
Inter-relationships among Spectral VI’s • VI’s behave similarly to each other under a ‘constant’ set of conditions, • If soils are not varying then NDVI and SAVI are well correlated, • If aerosol differences are minimal, then similarly there is minimal difference between EVI and SAVI.
NDVI & EVI Relationships MODIS Data (2000-2001) RT-Model
EVI & SAVI Relationships MODIS Data (2000-2001) RT-Model EVI
VI - FPAR Relationships NDVI EVI
…The Algorithm • Weighted average scheme
MODIS Standard VegetationIndex Products Products • The MODIS Products include 2 Vegetation Indices (NDVI, EVI) and QA produced at 16-day and monthly intervals at 250m/ 500m, 1km, and 25km resolutions • The narrower ‘red’ MODIS band provides increased chlorophyll sensitivity (band 1), • The narrower ‘NIR’ MODIS band avoids water vapor absorption (band 2) • Use of the blue channel in the EVI provides aerosol resistance
Radiometric Measures Vegetation Indices SR (Simple Ratio), MSR (Modified SR) SAVI (Soil Adjusted VI), MSAVI, ARVI, GEMI NDVI (Normalized Difference Vegetation Index) EVI (Enhanced Vegetation Index) Biophysical Measures Leaf Area Index (Area of leaves per unit ground area, m2/m2) FPAR (Fraction of incident PAR that is absorbed)
VI Equations SVI Formulations Simple Ratio = NIR/Red Normalized Difference = (NIR-Red)/(NIR+Red) • Enhanced Vegetation Index: -where r is atmospherically-corrected, surface reflectances, L is the canopy background adjustment, G is a gain factor, and C1 , C2 are coefficients for atmospheric resistance.
Annual average EVI • Amazon vegetation seasonal analyses and land conversion effects on biologic activity.
NDVI EVI 1 km VI’s Tapajós ‘Forest’ Day 113 - 128 EVI NDVI
Histograms of VI’s at 250 m, 500 m, and 1 km resolutions NDVI EVI South America (August 12 to August 27, 2000)
Analyses, Uncertainty & Validation • Heterogeneous surfaces (scaling issues) • Dynamic Range • Tropical forests & clouds • Arid/ semiarid regions • Snow - vegetation problems • Cloud shadows
Scaling issues & heterogenous surfaces Brasília – CCD/CBERS-1 Tropical forest conversion (Ikonos) CB2 - Minas Gerais - nov/03
100% 75% 50% 25% 75% 50% 25% 25% crop
Southwest Megadrought Analysis per land cover type (MODIS 3-year)
Inland water bodies (Caspian Sea) Traced to over/under corrected surface reflectance over water bodies Hypersensitivity of NDVI to the proportional relation between Red & NIR
Spatial issues (Blocky retrieval) Traced to Aerosol correction
Snow-Vegetation Surfaces • Snow has Red > NIR causing numerator of VI’s (NDVI, SAVI, EVI) to become negative (or decrease in case of mixed pixels). • Snow also has Blue > Red causing denominator of EVI equation to decrease and, at times, become negative
Inter-relationships among biophysical products (VI, LAI/FPAR) Global FPAR 2004 Global LAI 2004
MOD12Q2: Global Vegetation Phenology From Mark Friedl, Boston Univ. • First global products for vegetation phenology based on MODIS EVI data released for 2001-2004 • Identifies key transition • dates in growing season Onset EVI maximum Onset EVI increase Onset EVI minimum Onset EVI decrease