Download
1 / 12
120 likes | 382 Views
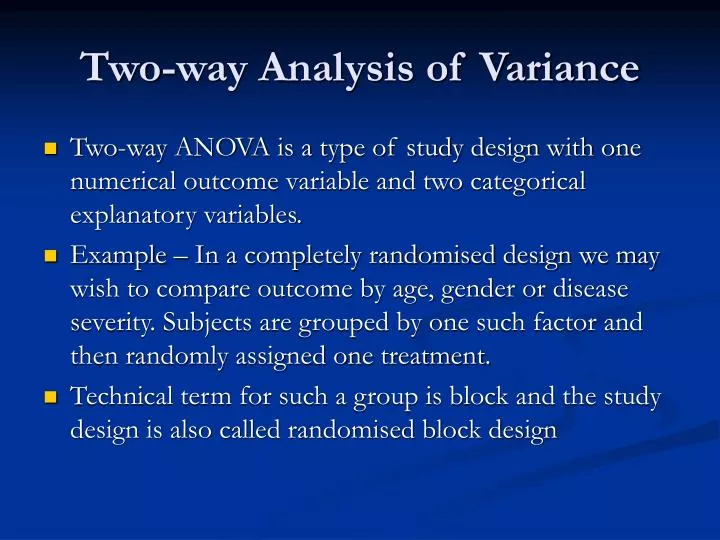
Two-way Analysis of Variance. Two-way ANOVA is a type of study design with one numerical outcome variable and two categorical explanatory variables.

E N D
Two-way Analysis of Variance • Two-way ANOVA is a type of study design with one numerical outcome variable and two categorical explanatory variables. • Example – In a completely randomised design we may wish to compare outcome by age, gender or disease severity. Subjects are grouped by one such factor and then randomly assigned one treatment. • Technical term for such a group is block and the study design is also called randomised block design
Analysis in Two-way ANOVA - 1 The variance (total sum of squares) is first partitioned intoWITHIN and BETWEEN sum of squares. Sum of Squares BETWEENis next partitioned by intervention, blocking and interaction SS TOTAL SS BETWEEN SS WITHIN SS INTERVENTION SS BLOCKING SS INTERACTION
Two-way ANOVA method. And an interaction between gender and teaching method is being sought. Analysis of Two-way ANOVA is demonstrated in the slides that follow. The study is about a n experiment involving a teaching method in which professional actors were brought in to play the role of patients in a medical school. The test scores of male and female students who were taught either by the conventional method of lectures, seminars and tutorials and the role-play method were recorded. The hypotheses being tested are: Role-play method is superior to conventional way of teaching. Female students in general have better test scores than male students. Role-play method makes a better impact on students of a particular gender. Thus, there are two factors – gender and teaching method. And an interaction between teaching method and gender is being sought.
Analysis in Two-way ANOVA - 2 • Each Sum of Squares (SS) is divided by its degree of freedom (df) to get the Mean Sum of Squares (MS). • The F statistic is computed for each of the three ratios as MS INTERVENTION ÷ MS WITHIN MS BLOCK ÷ MS WITHIN MS INTERVENTION ÷ MS WITHIN
Analysis of Two-way ANOVA - 3 Analysis of Variance for score Source DF SS MS F P sex 1 2839 2839 22.75 0.000 Tchmthd 1 1782 1782 14.28 0.001 Error 29 3619 125 Total 31 8240
Analysis of Two-way ANOVA - 4 Individual 95% CI Sex Mean --------+---------+---------+---------+--- 0 58.5 (------*------) 1 39.6 (-------*------) --------+---------+---------+---------+--- 40.0 48.0 56.0 64.0 Individual 95% CI Tchmthd Mean ---------+---------+---------+---------+-- 0 56.5 (-------*-------) 1 41.6 (-------*--------) ---------+---------+---------+---------+-- 42.0 49.0 56.0 63.0
Analysis of Tw0-way ANOVA - 5 Analysis of Variance for SCORE Source DF SS MS F P SEX 1 2839 2839 22.64 0.000 TCHMTHD 1 1782 1782 14.21 0.001 INTERACTN 1 108 108 0.86 0.361 Error 28 3511 125 Total 31 8240 Interaction is not significant P = 0.361
Analysis of Two-way ANOVA - 6 Individual 95% CI SEX Mean --------+---------+---------+---------+--- 0 58.5 (------*------) 1 39.6 (-------*------) --------+---------+---------+---------+--- 40.0 48.0 56.0 64.0 Individual 95% CI TCHMTHD Mean ---------+---------+---------+---------+-- 0 56.5 (-------*-------) 1 41.6 (-------*--------) ---------+---------+---------+---------+-- 42.0 49.0 56.0 63.0
Analysis of Two-way ANOVA by the regression method (reference coding) The regression equation is SCORE = 65.9 - 18.8 SEX - 14.9 TCHMTHD Predictor Coef SE Coef T P Constant 65.913 3.420 19.27 0.000 SEX -18.838 3.950 -4.77 0.000 TCHMTHD -14.925 3.950 -3.78 0.001 S = 11.17 R-Sq = 56.1% R-Sq(adj) = 53.1% Analysis of Variance Source DF SS MS F P Regression 2 4620.9 2310.4 18.51 0.000 Residual Error 29 3619.0 124.8 Total 31 8239.8
Analysis of Two-way ANOVA by the regression method (effect coding) The regression equation is SCORE = 49.0 - 9.42 EFCT-Sex - 7.46 EFCT-Tchmthd - 1.84 Interaction Predictor Coef SE Coef T P Constant 49.031 1.980 24.77 0.000 EFCT-Sex -9.419 1.980 -4.76 0.000 EFCT-Tch -7.463 1.980 -3.77 0.001 Interact -1.838 1.980 -0.93 0.361 S = 11.20 R-Sq = 57.4% R-Sq(adj) = 52.8%
Reference Coding and Effect Coding - 1 • In both methods, for k explanatory variables k-1 dummy variables are created. • In reference coding the value 1 is assigned to the group of interest and 0 to all others (e.g. Female =1; Male =0). • In effect coding the value −1 is assigned to control group; +1 to the group of interest (e.g. new treatment), and 0 to all others (e.g. Female =1; Male (control group) = −1; Role Play = +1; conventional teaching (control) = −1).
Reference Coding and Effect Coding - 2 • In reference coding the β coefficients of the regression equation provide estimates of the differences in means from the control (reference) group for various treatment groups. • In effect coding the β coefficients provide the differences from the overall mean response for each treatment group.