Download

1 / 10
110 likes | 410 Views
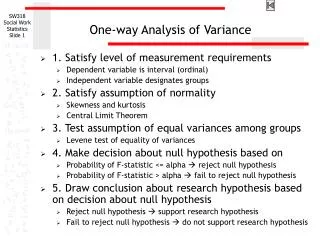
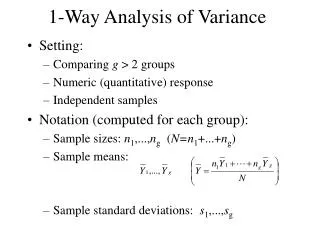
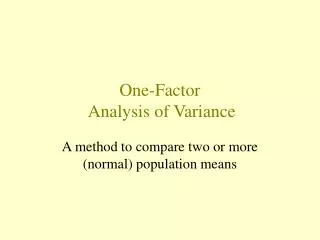
One-way Analysis of Variance. Analysis of Variance (ANOVA) is a technique for assessing the effect of an explanatory categorical variable on a normally distributed continuous outcome variable.

E N D
One-way Analysis of Variance Analysis of Variance (ANOVA) is a technique for assessing the effect of an explanatory categorical variable on a normally distributed continuous outcome variable. The categorical variable could be groups (e.g. in an observational study) or different treatments (as in an intervention study).
One-way Analysis of Variance The general principles for designing intervention studies with different treatments are: • Each subject should receive one treatment, chosen randomly from the list of treatments to be compared. • Each treatment should be used with several subjects. Then only we can get a proper measure of the variability in response between different subjects.
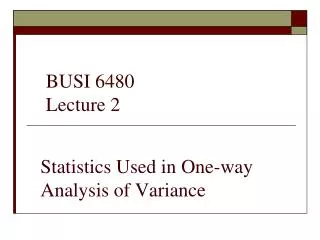
Statistics of ANOVA-1 • ANOVA is a multigroup generalisation of the t test. • The question a researcher is asking is “Are the differences in the means of the treatment groups due to the treatment or simply due to random variation?” • The variance is partitioned into two groups: • Within group variance • Between group variance
Statistics of ANOVA - 2 Variance is described as Sum of Squares in the computer printout Total Variance is partitioned as follows: SSTOTAL SSWITHIN SSBETWEEN F statistic is calculated by F = SS between subjects ÷ SS within subjects
Statistics of ANOVA - 3 • The following assumptions are made in using ANOVA: • Random sampling has been done to form the groups • A value for the response has been recorded in each subject • The response variable is normally distributed in each group • The variance of the response variable is the same in each group
One-way ANOVA The study described here is about measuring cortisol levels in 3 groups of subjects : • Healthy (n = 16) • Depressed – Non-melancholic depressed (n = 22) • Depressed – Melancholic depressed (n = 18)
Results • Results were obtained as follows Source DF SS MS F P Grp. 2 164.7 82.3 6.61 0.003 Error 53 660.0 12.5 Total 55 824.7 Individual 95% CIs For Mean Based on Pooled StDev Level N Mean StDev -+---------+---------+---------+----- 1 16 9.200 2.931 (------*------) 2 22 10.700 2.758 (-----*-----) 3 18 13.500 4.674 (------*------) -+---------+---------+---------+----- Pooled StDev = 3.529 7.5 10.0 12.5 15.0
Multiple Comparison of the Means - 1 • Several methods are available depending upon whether one wishes to compare means with a control mean (Dunnett) or just overall comparison (Tukey and Fisher) or comparison with “best”, in which case must specify the best as lowest or highest HSU’s MCB) Dunnett's comparisons with a control Family error rate = 0.0500 Individual error rate = 0.0276 Critical value = 2.27 Control = level (1) of Grp. Intervals for treatment mean minus control mean Level Lower Center Upper -----+---------+---------+---------+-- • 2 -1.127 1.500 4.127 (----------*----------) • 3 1.553 4.300 7.047 (----------*----------) • -----+---------+---------+---------+-- 0.0 2.5 5.0 7.5
Multiple Comparison of Means - 2 Tukey's pair wise comparisons Family error rate = 0.0500 Individual error rate = 0.0194 Critical value = 3.41 Intervals for (column level mean) − (row level mean) • 1 2 • 2 -4.296 • 1.296 • 3 -7.224 -5.504 • -1.376 -0.096 Fisher's pair wise comparisons Family error rate = 0.121 Individual error rate = 0.0500 Critical value = 2.006 Intervals for (column level mean) − (row level mean) • 1 2 • 2 -3.826 • 0.826 • 3 -6.732 -5.050 • -1.868 -0.550
Regression Approach to Analysis of Variance The regression equation is Cortisol = 9.20 + 1.50 Non-mela. + 4.30 Melanch. • Predictor Coef SE Coef T P • Constant 9.2000 0.8822 10.43 0.000 • Non-mela 1.500 1.159 1.29 0.201 • Melanch. 4.300 1.213 3.55 0.001 • S = 3.529 R-Sq = 20.0% R-Sq(adj) = 16.9% All of the ANOVA results are obtained through regression analysis. Each β coefficient adds a value relevant to its group to the baseline mean value of group 1 (healthy). We also know that depression accounts for 17% of the variance in Cortisol values. The t value of 3.55 for the melancholic group is significant, which is not the case for the non-melancholic group.