Download
1 / 8
80 likes | 192 Views
Predicting Species: Statistical Models. Problem: Given a DNA strand , does it come from corn ( ZEA mays ) or fruit fly ( Drosophila Melanogaster ) ?

E N D
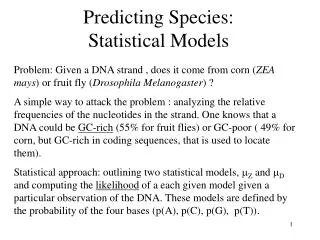
Predicting Species: Statistical Models Problem: Given a DNA strand , does it come from corn (ZEA mays) or fruit fly (Drosophila Melanogaster) ? A simple way to attack the problem: analyzing the relative frequencies of the nucleotides in the strand. One knows that a DNA could be GC-rich (55% for fruit flies) or GC-poor ( 49% for corn, but GC-rich in coding sequences, that is used to locate them). Statistical approach: outlining two statistical models, Z and D and computing the likelihood of a each given model given a particular observation of the DNA. These models are defined by the probability of the four bases (p(A), p(C), p(G), p(T)).
Likelihood Example : Given DNA strand: GATGTCGTAT Z = ( pZ(A), pZ(C), pZ(G) , pZ(T) ) = (0.255, 0.245, 0.245, 0.255) because the corn is 49% GC-rich. D = ( pD(A), pD(C), pD(G) , pD(T) ) = (0.225, 0.275, 0.275,0.225) Likelihood L( |O) of model given observation O is defined as: L( |O) = Pr(O | ) Example : Pr(GATGTCGTAT | Z ) = pZ(G) * pZ(A) * pZ(T) * … ~9.9*10-7 Pr(GATGTCGTAT | D ) = pD(G) * pD(A) * pD(T) * … ~7.4*10-7 The observations favor corn by odds of 9.9 / 7.4 = 1.34.
Lod score To avoid working directly with very small likelihoods, it is convenient to add the logarithms of the factors to obtain log likelihood. Example: log(L(Z |O)) = log(pZ(G) ) + log(pD(A) ) +… = -13.820 The log likelihood ratio ( log of odds or lod score) of the observation is: log(L(Z |O) / L(D |O) ) = -13.820 – (-14.116) = 0.296 The sign gives which observation is favored. Another advantage is that computation of lod scores is direct: an A or T contributes for log(0.255/0.225)~0.126 (or 0.126 nats) and C or G for –O.115. It results that the lod score is 4*(-O.115) + 6*(0.126) = 0.296.
Entropy For a « perfect » corn DNA sequence OZ of n bases(say containing 0.255*n A bases, 0.245*n C bases…), the likelihood log(L(Z | OZ) would be: log(L(Z | OZ)) = log(Pr(OZ | Z)) = (0.255*n)*log(0.255) + (0.255*n)*log(0.255) + (0.255*n)*log(0.255) + (0.255*n)*log(0.255) = -1.39n The number 1.39 gives a measure of how much observing a base of OZ contributes, on average, to the likelihood. It is called the entropy H(Z ) of Z. For a model , the entropy is defined by : H() = -log( p(A)p(A)* p(C) p(C)* p(G) p(G)* p(T) p(T)) H() = -( p(A)log(p(A)) + p(C)log(p(C)) + p(G)log(p(G)) + p(T)log(p(T)))
An example R is a random variable. R = 1: it will rain to morrow R = 0: it will not rain to morrow From Pr(R =1), can I decide just now to prepare or not my raincoat ? If Pr(R =1) = 0.95 (or Pr(R =0) = 0.5), the entropy is: -((O.95)*lg(O.95) + (0.05)*lg(0.05)) = 0.29 bits Sorelatively little new information will be gain if I look out the window to morrow before deciding to take my raincoat. That is not the case if Pr(R =1) = 0.5 as the entropy is maximum.
Relative entropy We are interested by the contribution of OZ of size n to learn if OZ is from corn rather from fruit fly. It is: ln(L(Z |OZ) / L(D | OZ) ) = ln(Pr(OZ | Z)/ Pr(OZ | D) ) = pZ(A) * log(pZ(A) /pD(A) ) +… = (0.255*n)*(0.126) + (0.245*n)*(-0.115) + + (0.245*n)*(-0.115) + (0.255*n)*(0.126) = 0.008*n The relative entropy H(Z | D) of Z with respect to D gives this information for one base. H(Z | D) = b{A, C, G, T} pZ(b) * log(pZ(b) /pD(b)) = 0.008 Application: To have hundred-to-one odds that a « perfect » corn is from corn rather than from fruit fly, we need n bases such that: 0.008*n = ln(100) or n ~576
Maximum likelihood models We are given a training set of corn DNA and asked to deduce the best model for corn. The maximum likelihood model is this one having parameters that make the likelihood for the training set the largest. It can be shown that if f(A), f(C), f(G), f(T) are the relative frequencies of A, C, G, and T in the training set then choosing p(A) = f(A), p(C) = f(C), p(G) = f(G), p(T) = f(T) maximizes the likelihood : p(A)n*f(A) *p(C)n*f(C) * p(G)n*f(G) * p(T)n*f(T) where n is the length of the training set. Equivalently it minimizes the entropy: -( p(A)*log(f(A)) + p(C)*log(f(C)) + p(G)*log(f(G)) + p(T)*log(f(T))
Mathematical independence • Be careful, we supposed: • p(A) = p(T), p(C) = p(G) • Each nucleotide in the sequence is an independent realization of the model distribution probability: C is neither more or less likely to follow A than to follow C, G or T.