Download

1 / 40
420 likes | 458 Views
ELASTICITY. Elasticity is the concept economists use to describe the steepness or flatness of curves or functions. In general, elasticity measures the responsiveness of one variable to changes in another variable. PRICE ELASTICITY OF DEMAND.

E N D
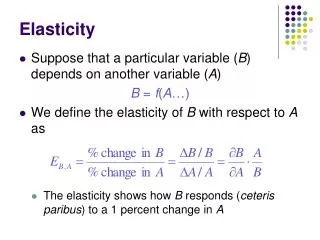
ELASTICITY • Elasticity is the concept economists use to describe the steepness or flatness of curves or functions. • In general, elasticity measures the responsiveness of one variable to changes in another variable. Elasticity
PRICE ELASTICITY OF DEMAND • Measures the responsiveness of quantity demanded to changes in a good’s own price. • The price elasticity of demand is the percent change in quantity demanded divided by the percent change in price that caused the change in quantity demanded. Elasticity
FACTS ABOUT ELASTICITY • It’s always a ratio of percentage changes. • That means it is a pure number -- there are no units of measurement on elasticity. • Price elasticity of demand is computed along a demand curve. Elasticity is not the same as slope. Elasticity
LOTS OF ELASTICITIES! • THERE ARE LOTS OF WAYS TO COMPUTE ELASTICITIES. SO BEWARE! THE DEVIL IS IN THE DETAILS. • MOST OF THE AMBIGUITY IS DUE TO THE MANY WAYS YOU CAN COMPUTE A PERCENTAGE CHANGE. BE ALERT HERE. IT’S NOT DIFFICULT, BUT CARE IS NEEDED. Elasticity
pE = $2.50 What’s the percent increase in price here because of the shift in supply? S' price S pE = $2 D Q QE CIGARETTE MARKET Elasticity
IS IT: • A) [.5/2.00] times 100? • B) [.5/2.50] times 100? • C) [.5/2.25] times 100? • D) Something else? Elasticity
From time to time economists have used ALL of these measures of percentage change -- • including the “Something else”! • Notice that the numerical values of the percentage change in price is different for each case: Go to hidden slide Elasticity
Economists usually use the “midpoint” formula (option C), above) to compute elasticity in cases like this in order to eliminate the ambiguity that arises if we don’t know whether price increased or decreased. Elasticity
Using the Midpoint Formula Elasticity = % change in p = times 100. % change in p = For the prices $2 and $2.50, the % change in p is approx. 22.22 percent. Elasticity
What’s the percent change in Q due to the shift in supply? S' price S pE’ = $2.50 pE = $2 D Q (millions) QE’ = 7 QE = 10 CIGARETTE MARKET Elasticity
Use the midpoint formula again. • Elasticity = • % change in Q = • % change in Q = • For the quantities of 10 and 7, the % change in Q is approx. -35.3 percent. (3/8.5 times 100) Elasticity
NOW COMPUTE ELASTICITY • % change in p = 22.22 percent • % change in Q = -35.3 percent E = -35.3 / 22.22 = -1.6 (approx.) Elasticity
But you can do the other options as well: • A) If you use the low price, and its corresponding quantity, as the base values, then elasticity = 1.2 • B) If you use the high price, and its corresponding quantity, as the base values, then elasticity = 2.1 (approx.) • C) And the midpoint formula gave 1.6 (approx.) • SAME PROBLEM...DIFFERENT ANSWERS!!! Elasticity
Compute elasticity between prices of $9 and $8. MORE ELASTICITY COMPUTATIONS QUANTITY PRICE P 0 10 14 1 9 12 2 8 10 3 7 8 4 6 6 5 5 4 6 4 2 7 3 Q 0 8 2 0 2 4 6 8 10 12 14 9 1 10 0 Elasticity
USE THE MIDPOINT FORMULA. The % change in Q = The % change in P = Therefore elasticity = Go to hidden slide Elasticity
Compute elasticity between prices of $3 and $2. Now we try different prices QUANTITY PRICE 0 10 P 1 9 14 2 8 12 3 7 10 4 6 8 6 5 5 4 6 4 2 7 3 Q 0 8 2 0 2 4 6 8 10 12 14 9 1 10 0 Elasticity
The % change in Q = The % change in P = Therefore elasticity = Go to hidden slide Elasticity
E = -5.67 E = -.33 ELASTICITY IS NOT SLOPE! QUANTITY PRICE Note that elasticity is different at the two points even though the slope is the same. (Slope = -1) P 0 10 14 1 9 12 2 8 10 3 7 8 4 6 6 5 5 4 6 4 2 7 3 Q 0 8 2 0 2 4 6 8 10 12 14 9 1 10 0 Elasticity
TERMS TO LEARN • Demand is ELASTIC when the numerical value of elasticity is greater than 1. • Demand is INELASTIC when the numerical value of elasticity is less than 1. • Demand is UNIT ELASTIC when the numerical value of elasticity equals 1. • NOTE: Numerical value here means “absolute value.” Elasticity
Demand is elastic here. Demand is inelastic here. LIKE THIS! P QUANTITY PRICE 14 0 10 12 1 9 10 2 8 8 3 7 6 4 6 4 5 5 2 6 4 Q 0 7 3 0 2 4 6 8 10 12 14 8 2 9 1 10 0 Elasticity
A FINAL ELASTICITY MEASURE • POINT ELASTICITY OF DEMAND • If you know or can see the demand curve for a good (you don’t know just two points), you can compute “point elasticity of demand” at a single point on the demand curve. • Here’s the idea: Elasticity
The % change in price can be written as: • P)/Pbase times 100 • The % change in quantity can be written as: • Q)/Qbase times 100 • So elasticity is: (Q)/ (P)) ( Pbase / Qbase) Elasticity
So elasticity is Q)/ (P) multiplied by the ratio of base price to base quantity. • Point elasticity uses this formula to compute the elasticity of demand AT A POINT on a demand curve. Elasticity
EXAMPLE P Elasticity at a price of $3 is .90. 6 $3 D Q 10 18 Elasticity
There is an important relationship between what happens to consumers’ spending on a good and elasticity when there is a change in price. • Spending on a good = P Q. • Because demand curves are negatively sloped, a reduction in P causes Q to rise and the net effect on PQ is uncertain, and depends on the elasticity of demand. Elasticity
Demand is elastic here. At P = $9, spending is $9 (= 1 times $9). At P = $8, spending is $16 ( = 2 times $8). When price fell from $9 to $8, spending rose. Q must have increased by a larger percent than P decreased. So... QUANTITY PRICE 0 10 P 1 9 14 2 8 12 3 7 10 4 6 8 5 5 6 6 4 4 7 3 2 8 2 0 Q 9 1 0 2 4 6 8 10 12 14 10 0 Elasticity
Demand is inelastic here. At P = $3, spending is $21 (= 7 times $3). At P = $2, spending is $16 ( = 8 times $2). When price fell from $3 to $2, spending fell. Q must have increased by a smaller percent than P decreased. So... QUANTITY PRICE P 0 10 14 1 9 12 2 8 10 3 7 8 4 6 6 5 5 4 6 4 2 7 3 0 8 2 Q 0 2 4 6 8 10 12 14 9 1 10 0 Elasticity
There is an easy way to tell whether demand is elastic or inelastic between any two prices. • If, when price falls, total spending increases, demand is elastic. • If, when price falls, total spending decreases, demand is inelastic. Elasticity
But total spending is easy to see using a demand curve graph: P QUANTITY PRICE 14 0 10 12 1 9 The shaded area is P times Q or total spending when P = $9. 10 2 8 8 3 7 6 4 6 4 5 5 6 4 2 7 3 0 Q 0 2 4 6 8 10 12 14 8 2 9 1 10 0 Elasticity
P 14 PRICE QUANTITY 12 The shaded area is P times Q or total spending when P = $8. 0 10 10 1 9 8 2 8 6 3 7 4 4 6 2 5 5 0 Q 6 4 0 2 4 6 8 10 12 14 7 3 8 2 9 1 10 0 Elasticity
= loss in TR due to fall in P = gain in TR due to rise in Q P 14 QUANTITY PRICE 12 0 10 10 1 9 Total spending is higher at the price of $8 than it was at the price of $9. 8 2 8 6 3 7 4 4 6 2 5 5 6 4 0 Q 0 2 4 6 8 10 12 14 7 3 8 2 9 1 10 0 Elasticity
P 14 QUANTITY PRICE 12 0 10 The shaded area is total spending (total revenue of sellers) when P = $3. 1 9 10 2 8 8 3 7 6 4 6 4 5 5 2 6 4 0 7 3 Q 0 2 4 6 8 10 12 14 8 2 9 1 10 0 Elasticity
P QUANTITY PRICE 14 0 10 12 1 9 Total revenue of sellers (total spending by buyers) falls when price falls from $3 to $2. 10 2 8 8 3 7 6 4 6 4 5 5 2 6 4 7 3 0 Q 0 2 4 6 8 10 12 14 8 2 9 1 10 0 Elasticity
relatively more elastic at p* relatively more inelastic at p* Here’s a convenient way to think of the relative elasticity of demand curves. p p* Q Q* Elasticity
Examples of elasticity • Doctors through the AMA restrict the supply of physicians. How does this affect the incomes of doctors as a group? • A labor union negotiates a higher wage. How does this affect the incomes of affected workers as a group? • MSU decides to raise the price of football tickets. How is income from the sale of tickets affected? • Airlines propose to raise fares by 10%. Will the boost increase revenues? Elasticity
MORE ... • MSU is considering raising tuition by 7%. Will the increase in tuition raise revenues of MSU? • CATA recently raised bus fares in the Lansing area. Will this increase CATA’s total receipts? Elasticity
The answers to all of these questions depend on the elasticity of demand for the good in question. Be sure you understand how and why! Elasticity
DETERMINANTS OF DEMAND ELASTICITY • The more substitutes there are available for a good, the more elastic the demand for it will tend to be. [Related to the idea of necessities and luxuries. Necessities tend to have few substitutes.] • The longer the time period involved, the more elastic the demand will tend to be. • The higher the fraction of income spent on the good, the more elastic the demand will tend to be. Elasticity
OTHER ELASTICITY MEASURES • In principle, you can compute the elasticity between any two variables. • Income elasticity of demand • Cross price elasticity of demand • Elasticity of supply Elasticity
Each of these concepts has the expected definition. For example, income elasticity of demand is the percent change in quantity demand divided by a percent change income: • EINCOME = • Income elasticity of demand will be positive for normal goods, negative for inferior ones. Elasticity