Download
1 / 27
270 likes | 281 Views
Chapter 10 Re-expressing the data. If the relationship is nonlinear. We may re-express the data to straighten the bent relationship so that we can fit and use a simple linear model Simple ways to re-express data Logarithms square root reciprocals. Straight to the Point (cont.).

E N D
If the relationship is nonlinear • We may re-express the data to straighten the bent relationship so that we can fit and use a simple linear model • Simple ways to re-express data • Logarithms • square root • reciprocals
Straight to the Point (cont.) • The relationship between fuel efficiency (in miles per gallon) and weight (in pounds) for late model cars looks fairly linear at first
Straight to the Point (cont.) • The relationship between fuel efficiency (in miles per gallon) and weight (in pounds) for late model cars looks fairly linear at first • Using the linear model, we get the intercept 40.65, slope -0.0057 and R-squared 82%.
Straight to the Point (cont.) • The relationship between fuel efficiency (in miles per gallon) and weight (in pounds) for late model cars looks fairly linear at first • Using the linear model, we get the intercept 40.65, slope -0.0057 and R-squared 82%. • This model predicts the fuel efficiency of a Hummer H2 (about 6400 lb) to be 4.2 mpg which is far less than the reported value 11.0 mpg.
Straight to the Point (cont.) • A look at the residuals plot shows a problem:
Straight to the Point (cont.) • We can re-express fuel efficiency as gallons per mile (a reciprocal) and eliminate the bend in the original scatterplot:
Straight to the Point (cont.) • A comparison of two scatter plots
Straight to the Point (cont.) • A look at the residuals plot for the new model seems more reasonable • R-squared of this model is 88% • This model predicts the fuel efficiency of Hummer H2 to be 11.1 mpg.
Comparison on Lincoln Navigator (2000) • Weight = 7,200 lbs • Predicted mpg is about -0.32! (before re-expressing the data) • After re-expressing the data, predicted mpg = 9.8 (reported 11.0)
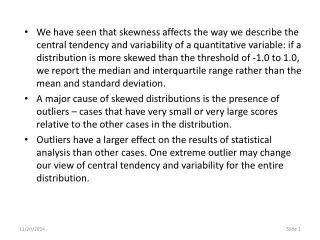
When do we need to re-express data? • To make skewed distributions more symmetric • Why? • Easier to summarize symmetric distributions • We can use mean and sd • We can use a normal model • It does not help to reduce the number of modes!!!
Assets of 77 large companies After log transformation
When do we need to re-express data? 2. Make the spread of several groups more alike • Why? • Easier to compare groups that share a common spread • Some statistical methods require the assumption that all groups have a common sd
Assets by market sectors After log transformation
When do we need to re-expressing data? 3. Make the relationship more linear • Why? • To apply linear regression It does not help if the scatterplot turns around (go up and then down or down then up)
Assets vs. Sales After log transformation
Power Name Comment 2 Square of data values Try with unimodal distributions that are skewed to the left. 1 Raw data Data with positive and negative values and no bounds are less likely to benefit from re-expression. ½ Square root of data values Counts often benefit from a square root re-expression. For counted data, start here. “0” We’ll use logarithms here Measurements that cannot be negative often benefit from a log re-expression. Good start point. -1/2 Reciprocal square root An uncommon re-expression, but sometimes useful. -1 The reciprocal of the data Ratios of two quantities (e.g., mph) often benefit from a reciprocal.
Multiple Benefits • We often choose a re-expression for one reason and then discover that it has helped other aspects of an analysis. • For example, a re-expression that makes a histogram more symmetric might also straighten a scatterplot or stabilize variance.
Why Not Just a Curve? • If there’s a curve in the scatterplot, why not just fit a curve to the data? • Computationally more difficult • Straight lines are easy to understand and interpret
A general principle • Occam’s Razor entia non sunt multiplicanda praeter necessitatem • entities should not be multiplied beyond necessity. When multiple competing theories are equal in other respects, the principle recommends selecting the theory that introduces the fewest assumptions and postulates the fewest hypothetical entities
What Can Go Wrong? • Don’t expect your model to be perfect. • Don’t choose a model based on R2 alone: • Example: large R2, but residual plot shows curvature
What Can Go Wrong? (cont.) • Beware of multiple modes. • Re-expression cannot pull separate modes together. • Watch out for scatterplots that turn around. • Re-expression can straighten many bent relationships, but not those that go up and down.
What Can Go Wrong? (cont.) • Watch out for negative data values. • Can NOT use log or square root transformations • Watch for data far from 1. • Data values that are all very far from 1 may not be much affected by re-expression unless the range is very large. If all the data values are large (e.g., years), consider subtracting a constant to bring them back near 1. • Don’t stray too far from the ladder • Too difficult to interpret
What have we learned? • When the conditions for regression are not met, a simple re-expression of the data may help. • A re-expression may make the: • Distribution of a variable more symmetric. • Spread across different groups more similar. • Form of a scatterplot straighter. • Scatter around the line in a scatterplot more consistent.
What have we learned? (cont.) • Taking logs is often a good, simple starting point. • To search further, the Ladder of Powers or the log-log approach can help us find a good re-expression. • Our models won’t be perfect, but re-expression can lead us to a useful model.