Download
1 / 26
280 likes | 576 Views
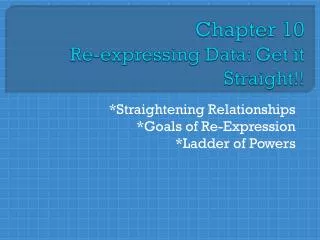
Chapter 10: Re-expressing data – Get it straight!. AP Statistics. Straightening data.

E N D
Chapter 10: Re-expressing data –Get it straight! AP Statistics
Straightening data • We cannot use a linear model unless the relationship between the two variables is linear. Often re-expression can save the day, straightening bent relationships so that we can fit and use a simple linear model. • Two simple ways to re-express data are with logarithms and reciprocals.
Straightening data (cont.) • The relationship between fuel efficiency (in miles per gallon) and weight (in pounds) for late model cars looks fairly linear at first:
Straightening data (cont.) • A look at the residuals plot shows a problem:
Straightening data (cont.) • We can re-express fuel efficiency as gallons per hundred miles (a reciprocal-multiplying each by 100) and eliminate the bend in the original scatterplot:
Straightening data (cont.) • A look at the residuals plot for the new model seems more reasonable:
Goals of re-expressions • Goal 1: Make the distribution of a variable (as seen in its histogram, for example) more symmetric.
Goals of re-expressions (cont.) • Goal 2: Make the spread of several groups (as seen in side-by-side boxplots) more alike, even if their centers differ.
Goals of re-expressions (cont.) • Goal 3: Make the form of a scatterplot more nearly linear.
Goals of re-expressions (cont.) • Goal 4: Make the scatter in a scatterplot spread out evenly rather than thickening at one end. • This can be seen in the two scatterplots we just saw with Goal 3:
The ladder of powers • There is a family of simple re-expressions that move data toward our goals in a consistent way. This collection of re-expressions is called the Ladder of Powers. • The Ladder of Powers orders the effects that the re-expressions have on data. • The farther you move from “1” in the ladder of powers, the greater the effect on the original data.
Power Name Comment 2 Square of data values Try with unimodal distributions that are skewed to the left. 1 Raw data Data with positive and negative values and no bounds are less likely to benefit from re-expression. ½ Square root of data values Counts often benefit from a square root re-expression. “0” We’ll use logarithms here Measurements that cannot be negative often benefit from a log re-expression. –1/2 Reciprocal square root An uncommon re-expression, but sometimes useful. –1 The reciprocal of the data Ratios of two quantities (e.g., mph) often benefit from a reciprocal. The ladder of powers (cont.)
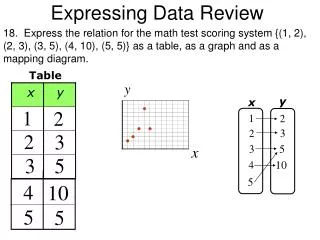
Example: with What transformation might you start? • You want to model the relationship between the number of birds counted at a nesting site and the temperature (in degrees Celsius). The scatterplot of counts vs. temperature shows an upwardly curving pattern, with more birds spotted at higher temperatures. • You want to model the relationship between prices for various items in Paris and in Hong Kong. The scatterplot of Hong Kong prices vs. Parisian prices shows a generally straight pattern with a small amount of scatter. • You want to model the population growth of the US over the past 200 years. The scatterplot shows a strongly upwardly curved pattern.
Plan B: Attack of the Logarithms • When none of the data values is zero or negative, logarithms can be a helpful ally in the search for a useful model. • Try taking the logs of both the x- and y-variable. • Then re-express the data using some combination of x or log(x) vs. y or log(y).
Multiple benefits • We often choose a re-expression for one reason and then discover that it has helped other aspects of an analysis. • For example, a re-expression that makes a histogram more symmetric might also straighten a scatterplot or stabilize variance. • Try the TI Tips on p. 233.
Day 2 Why Not Just Use a Curve? • If there’s a curve in the scatterplot, why not just fit a curve to the data?
Why Not Just Use a Curve? (cont.) • The mathematics and calculations for “curves of best fit” are considerably more difficult than “lines of best fit.” • Besides, straight lines are easy to understand. • We know how to think about the slope and the y-intercept.
TI Tips on Page 234 • Complete this to note some potential shortcuts to re-expressing data.
What Can Go Wrong? • Don’t expect your model to be perfect. • Don’t stray too far from the ladder. • Don’t choose a model based on R2 alone. Plot the residual.
What Can Go Wrong? (cont.) • Beware of multiple modes. • Re-expression cannot pull separate modes together. • Watch out for scatterplots that turn around. • Re-expression can straighten many bent relationships, but not those that go up then down, or down then up.
What Can Go Wrong? (cont.) • Watch out for negative data values. • It’s impossible to re-express negative values by any power that is not a whole number on the Ladder of Powers or to re-express values that are zero for negative powers. • Watch for data far from 1. • Data values that are all very far from 1 may not be much affected by re-expression unless the range is very large. If all the data values are large (e.g., years), consider subtracting a constant to bring them back near 1.
recap • When the conditions for regression are not met, a simple re-expression of the data may help. • A re-expression may make the: • Distribution of a variable more symmetric. • Spread across different groups more similar. • Form of a scatterplot straighter. • Scatter around the line in a scatterplot more consistent.
Recap (cont.) • Taking logs is often a good, simple starting point. • To search further, the Ladder of Powers or the log-log approach can help us find a good re-expression. • Our models won’t be perfect, but re-expression can lead us to a useful model.
Chapter 10 Example • Let’s try the Chapter 10 example (worksheet).
Assignments: pp. 239 – 244 • Day 1: # 1, 5, 7, 11 • Day 2: # 3, 8, 9, 10 • Day 3: # 6, 13, 14, 15 • Day 4: # 17, 18, 27, 28