1 / 1

Sandra’s Map that Illustrates Links Between Activities and Goals

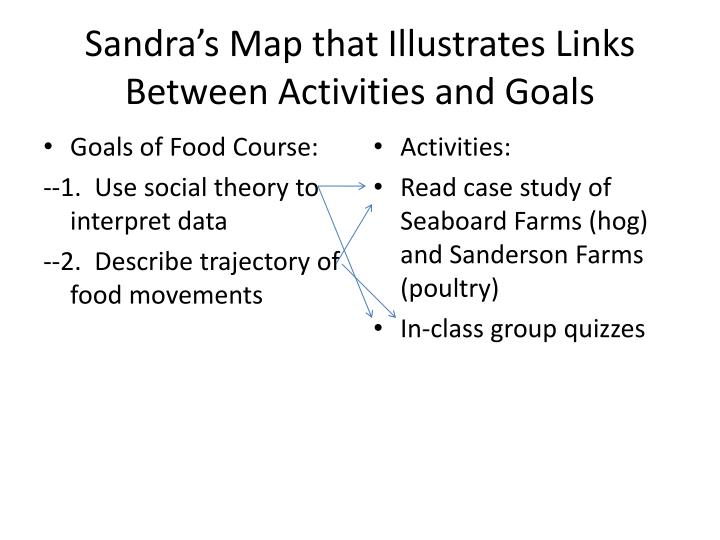
Sandra’s Map that Illustrates Links Between Activities and Goals. Goals of Food Course: --1. Use social theory to interpret data --2. Describe trajectory of food movements. Activities: Read case study of Seaboard Farms (hog) and Sanderson Farms (poultry) In-class group quizzes.

glain
Download Presentation

Sandra’s Map that Illustrates Links Between Activities and Goals

An Image/Link below is provided (as is) to download presentation Download Policy: Content on the Website is provided to you AS IS for your information and personal use and may not be sold / licensed / shared on other websites without getting consent from its author. Content is provided to you AS IS for your information and personal use only. Download presentation by click this link. While downloading, if for some reason you are not able to download a presentation, the publisher may have deleted the file from their server. During download, if you can't get a presentation, the file might be deleted by the publisher.

E N D

Presentation Transcript


  1. Sandra’s Map that Illustrates Links Between Activities and Goals • Goals of Food Course: --1. Use social theory to interpret data --2. Describe trajectory of food movements • Activities: • Read case study of Seaboard Farms (hog) and Sanderson Farms (poultry) • In-class group quizzes

More Related