Download
1 / 13
130 likes | 225 Views
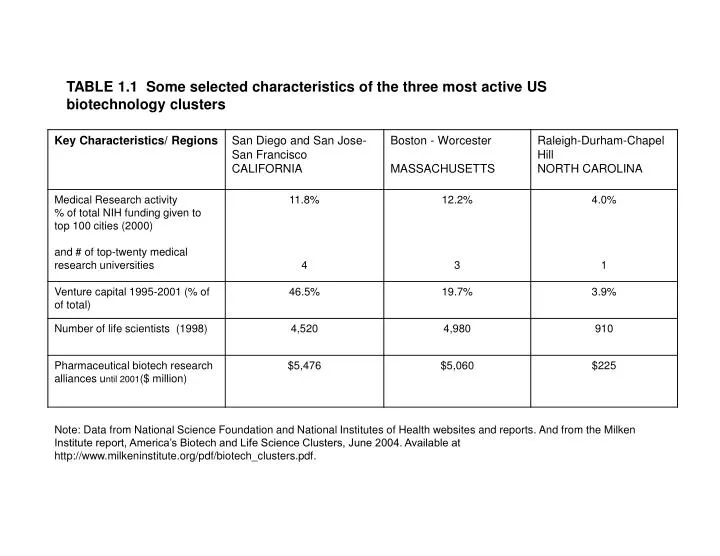
TABLE 1.1 Some selected characteristics of the three most active US biotechnology clusters.

E N D
TABLE 1.1 Some selected characteristics of the three most active US biotechnology clusters Note: Data from National Science Foundation and National Institutes of Health websites and reports. And from the Milken Institute report, America’s Biotech and Life Science Clusters, June 2004. Available at http://www.milkeninstitute.org/pdf/biotech_clusters.pdf.
Table 1.2 Global biotechnology clusters with number of private and public companies Data source: Ernst and Young’s “Beyond Borders: Global Biotechnology Report 2006” NOTE: California includes San Francisco, San Diego and Los Angeles/Orange County (in decreasing order of total # of public companies present)
Table 1.3 Top states with medical device companies in the US
Table 2.1 Major market segments of world-wide pharmaceutical sales. Data from IMS Retail drug market report for 2005. Figures are from sales for the calendar year 2005, in *selected countries around the world (only audited data included). Total global pharma market is estimated at $605 billion per other reports.
Table 2.2 Major therapy segments of world-wide medical device sales. Data from Standard and Poors Medical device industry survey 2004. Data is projected sales in 2005 and does not include medical supplies and consumables market (approx $100 billion industry). Data collected from company reports and Standard and Poors estimates.
Table 2.3 Major market segments of world-wide in vitro diagnostics (FIVD) sales. Data from "The Worldwide Market for In Vitro Diagnostic Tests," 4th ed. October 15, 2004. New York: Kalorama Information. Available from http://www.marketresearch.com
Table 2.4 Drugs, devices, and IVD revenues segmented by nation or region. * from IMS drug retail report Jul 2005 ** from Datamonitor report for 2001 + From Standard and Poor’s Industry survey 2005 and Epsicom Business Intelligence 2004. ++ population from http://www.geohive.com/cd/regindex.php NA – not available or estimates not reliable
Table 7.1 National health care costs - part of GDP and per capita Source: CMS, office of the actuary, US Dept of Commerce, Bureau of Economic Analysis, US Bureau of the Census
National Health Expenditures as a Share of Gross Domestic Product (GDP) FIGURE 7.1 Between 2001 and 2011, health spending is projected to grow 2.5 percent per year faster than GDP, so that by 2011 it will constitute 17 percent of GDP. Actual Projected Percent of GDP Calendar Years Source: CMS, Office of the Actuary, National Health Statistics Group.
FIGURE 7.3: The distribution of payments across various payers in the US healthcare system shows that the government pays for almost half of the healthcare bill. ‘‘Other public’’ includes programs such as worker’s compensation, public health activity, Department of Defense, Department of Veterans Affairs, Indian Health Service, state and local hospital subsidies, and school health; ‘‘Other private’’ includes industrial in-plant, privately funded construction, and nonpatient revenues, including philanthropy. Data and figure source: CMS, Office of Actuary, National Health Statistics Group.
Figure 7.5: Percentage of health care payments to specific groups of service and good providers in 2004. Other spending includes dentist services, other professional services, home health, durable medical products, over-the-counter medicine and sundries, public health, other personal health care, research and structures and equipment Source: CMS, Office of the Actuary, National Health Statistics Group.