Download
1 / 15
150 likes | 272 Views
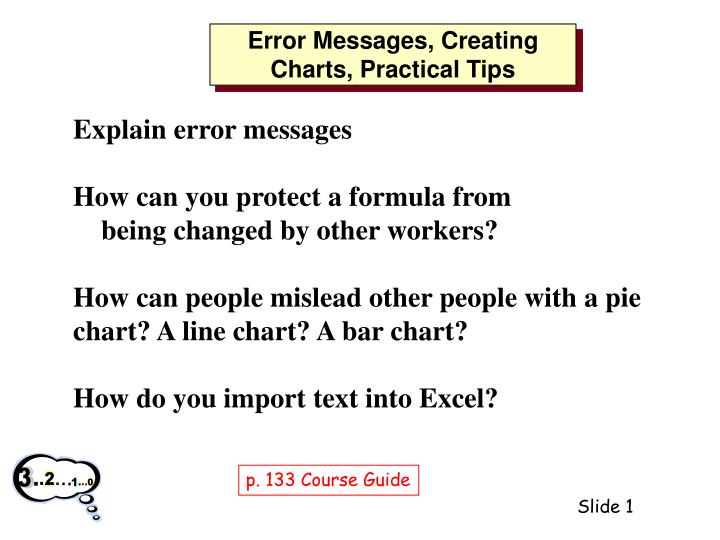
Error Messages, Creating Charts, Practical Tips. Explain error messages How can you protect a formula from being changed by other workers? How can people mislead other people with a pie chart? A line chart? A bar chart? How do you import text into Excel?. p. 133 Course Guide.

E N D
Error Messages, Creating Charts, Practical Tips Explain error messages How can you protect a formula from being changed by other workers? How can people mislead other people with a pie chart? A line chart? A bar chart? How do you import text into Excel? p. 133 Course Guide
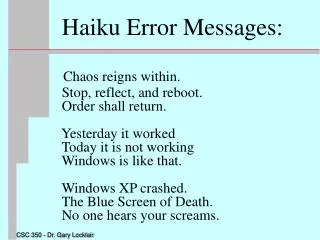
Error Messages (sometimes change with versions of Excel) • ##### Column not wide enough • #NAME? Excel doesn't recognize the text in a formula. For example, =SUM(Profits) (“Profits” is not a named range), or you omit the colon in a range as in = SUM(A1A10) • #REF! Perhaps a cell reference is not valid: For example, you refer to cell B0 #N/A (NOT AVAILABLE) • Using VLOOKUP, for example—data needed is not available
Error Messages, cont. • #NUM! a problem occurs with a number =SQRT(-45) (you cannot have a square root of a negative number) • #VALUE! the wrong type of argument or operand is used (a string and a number) =“cat”+1 • #DIV/0! when a formula divides by zero (often happens when you divide by an empty cell)
Protecting from idiots • What happens when someone else uses your precious spreadsheet? • Protect your formulas, formatting, and data! • To activate, Format/Cells/Protection • Hidden (hide formulas!) • Locked (locked) • Then Tools/Protection/Protect Sheet • You have to have ONLY one workbook open, or be working on the first one.
Be Wary of Using the Wrong Type of Chart (or learn how to give your data the best “spin”) • Charts can be misleading • Be sure to label correctly • Know what the purpose of a chart is • Beware of special effects
Line Charts Make the trade balance look terrible!
Another trick (pun) Why put the games in any sort of numerical order? David Lane--http://cnx.rice.edu/content/m10927/latest/
Bar or Column Charts Used to compare one data element with another data element.
Pie Charts Poor – cannot tell proportion: Used to show the proportions of individual components compared to the total. Better proportion: iMac buyers and their previous computer. David Lane--http://cnx.rice.edu/content/m10927/latest/
Parts of a Chart Title Legend Data Series Y-Axis Title X-Axis Title X-Axis Y-Axis
Importing Data into Excel • You can import data and not have to retype it. • Excel can create spreadsheets from Word tables • You can import and export spreadsheets and databases