Download
1 / 49
520 likes | 695 Views
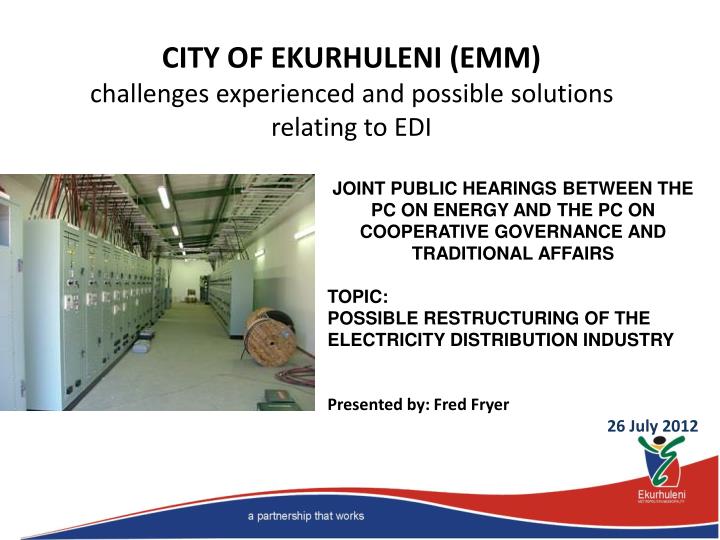
CITY OF EKURHULENI (EMM) challenges experienced and possible solutions relating to EDI. JOINT PUBLIC HEARINGS BETWEEN THE PC ON ENERGY AND THE PC ON COOPERATIVE GOVERNANCE AND TRADITIONAL AFFAIRS TOPIC: POSSIBLE RESTRUCTURING OF THE ELECTRICITY DISTRIBUTION INDUSTRY Presented by: Fred Fryer

E N D
CITY OF EKURHULENI (EMM) challenges experienced and possible solutions relating to EDI JOINT PUBLIC HEARINGS BETWEEN THE PC ON ENERGY AND THE PC ON COOPERATIVE GOVERNANCE AND TRADITIONAL AFFAIRS TOPIC: POSSIBLE RESTRUCTURING OF THE ELECTRICITY DISTRIBUTION INDUSTRY Presented by: Fred Fryer 26 July 2012
EKURHULENI ENERGY AT A GLANCE • EMM has 48 bulk infeed points from Eskom • The July 2011 account to Eskom was R890 million • Bulk purchase account from Eskom in 2012/2013 will be R6,7 billion • EMM predicted income from electricity sales is about R10 billion • The City has the following numbers of electricity meters: • Credit meters = 183 000 • Large meters = 6 000 • Prepayment meters = 206 000 • Total meters = +- 400 000 • Eskom supply areas inside EMM boundaries = +-144 000 meters • Larger customer meters = +-278
The graph shows that electricity sales have generally declined, with a slight increase in 2011 • This indicates a struggling economy or rising electricity prices forcing efficiency
DISCUSSION: • EMM total is 5,2% (see right hand side bar of graph) • Brakpan Depot has the highest losses, but is also the smallest of EMM depots (previous slide, 6% of EMM kWh units) • Non-technical losses can be reduced (consist of bypassed meters, illegal connections, billing errors, meter errors, etc)
DEMAND METERS – safeguarding income • Snapshot of internet based automated meter reading in place for all demand metered customers
DEMAND METERS – safeguarding income • Snapshot of internet based automated meter reading in place for all demand metered customers – graphical representation
WHAT IS THE PROBLEM? • Electricity prices are soaring • The value of electricity is, therefore, also rising • Valuable assets become a target for criminal elements, who will generate illegal income to themselves • The Electricity Distribution Industry must respond to this threat
VANDALISM AND THEFT (1) • The photo was taken in July 2012, in Villa Liza x2, Boksburg • 6 prepayment meters in one pole top box, all bypassed, at least 4 meters destroyed • A capital intervention is required involving protective structures and new meters • The uncontrolled electricity consumption destroys transformer and cable insulation, even to the point that they catch fire
VANDALISM AND THEFT (2)Higher end customer meter tampered High level of professionalism by tampering person…
FACTORS AVOIDING UNNECESSARY COSTS • Reduction in prepayment tampering • customers with bypassed meters often use excessive amounts of electricity, EMM purchases each unit from Eskom at 51c in summer and 88c in winter. These units are not “sold” again, i.e. an ave of 60c per unit lost, with no income from that. • If one considers an average of 10% technical and non-technical losses, the above figures are 57c and 98c respectively, averaging at 67c/kWh unit. • Prepayment meter tampering reduction = • lower consumption, • lower Eskom (or bulk purchase) account, • lower network stress, • lower maintenance and standby, • higher network reliability, • higher income
TYPICAL METERING USED Split prepayment meter, with metering element safely contained inside meterbox Split prepayment meter keypad (or customer interface) installed in the house
PROTECTIVE STRUCTURE – SAFEGUARDING ELECTRICITY METERS FROM INTERFERENCE
GENERAL OVERVIEW OF PROBLEMS EXPERIENCED IN ESKOM SUPPLY AREAS INSIDE EMM BOUNDARIES (1) • EMM is unable to leverage payment for other services, by means of the control of electricity – residents, therefore, pay only for electricity (to Eskom) • Ekurhuleni controls electricity theft in own supply areas by means of capex investment in “protective structures” and split prepayment meters – there are numerous requests by EMM residents to be supplied by Eskom (reason may be to avoid having to pay) • EMM has areas where electricity networks are vandalized to a point where the network must be rebuilt, e.g. Langaville, Brakpan – costs are known to be at about R16 000 per stand (network rebuilt, protective structure, split prepayment meter)
GENERAL OVERVIEW OF PROBLEMS EXPERIENCED IN ESKOM SUPPLY AREAS INSIDE EMM BOUNDARIES (2) • Creating a sustainable network may then be (if all Eskom supply stands need networks to be rebuilt): • 144 000 stands x R16 000 per stand • = R2,3 billion • (assuming no additional upstream capacity is required) • Revenue is only likely to be generated sustainably, if the network is reliable and fairly resistant to tampering, i.e. after investment • A cost benefit analysis should take into account avoided costs: • Such as less energy purchased from Eskom when electricity consumption paid for, levels out at 300 to 350 units per month per customer • And additional income: • Such as when water consumption is paid for
GENERAL OVERVIEW OF PROBLEMS EXPERIENCED IN ESKOM SUPPLY AREAS INSIDE EMM BOUNDARIES (3) • Prior to July 2012, Eskom and EMM tariffs for residential customers were not the same: • The Eskom IBT was lower than the EMM IBT • The differentiation in tariff levels created tension between the two sets of customers • Since 1 July, the EMM and Eskom IBT’s are the same* • *Change made to upper blocks to prevent windfall benefit to higher end customers • EMM supplies FBE to Eskom customers valued at +-R60 million per annum
SOLUTIONS TO BE EXPLORED (1) • One solution may involve EMM to supply all customers within our boundaries • This will be capital intensive • Capital will have to be phased, skilled resources and material will not be available in one go • Adding 144 000 customers is a 41% increase in numbers • Opex budgets may have to increase by a higher margin, given the level of interference with networks • Other resources will have to increase (staff, vehicles, etc) • As per the original Metro-RED concept, these resources could be taken over from Eskom? • Complex barriers – licensed areas, employee + customer issues, more • A second solution may involve cooperation between EMM and Eskom to also recover income from other services • This will still be capital intensive • Complex technical and other barriers…
SOLUTIONS TO BE EXPLORED (2) • Execute EMM feasibility study • Engage with National Government on: • Eskom licensed supply areas inside EMM • The investment that will be required (by Eskom) to hand over a commercially viable electrical network, to EMM • The likely reaction by communities who may not have been paying for electricity for decades… • Who will also realize that the bigger picture involves paying for other municipal services as well… • Following success in terms of the above: • Engage with Eskom on a suitable area to commence the take-over: • based on the condition being acceptable • Resolve institutional capacity matters, so that human resources are available to execute work in this area • Opex budget to support work in this area
SOLUTIONS TO BE EXPLORED (3) • Consolidate the learning process acquired through the first area taken over • Commence with the second area • And so forth
SUCCESS IS POSSIBLE • Our experience in Langaville (and other areas) shows that creating a commercially viable area (i.e. electrical network restored and protected) can result in excellent payment levels in EMM • Our experience indicate that a significant amount of work and other resources are required to reach the stage depicted in the next slide
LANGAVILLE IN EMM • Langaville proper has 2 038 active meters • EMM electricity income was at a low of R2 300 per month for Langaville • Average account of R1,13c per month • Post intervention – income is R280 000 (or an average account of R138 pm, ave 250 units pm) • The R138 per month is payable after 100 units FBE were received, which = R67
UNIVERSAL ACCESS CHALLENGES • Funding allocation • Procurement Processes • Reliant on Human Settlement plans • Houses built in Phases • Growing number of Informal Settlements • Service delivery protests
OPERATIONS CLUSTER ENERGY DEPARTMENT
MUNICIPAL / ESKOM TARIFF GAP SOLUTION PROPOSED • The previous graph showed the EMM – Eskom tariff gap • This is 114c/kWh – 84c/kWh measured at a 30% load factor • This is by far not the highest gap that one will encounter when repeating this exercise for other municipalities • EMM envisions the solution as follows: • In July 2012, NERSA allowed Eskom a 16% increase to “own” customers, and • A 13,5% increase to Eskom’s municipal customers • This has the effect of narrowing the gap between the Eskom line and the municipal line (previous slide) • It is proposed that NERSA considers continuing this trend in future financial years
CONCLUSION The City wishes to thank the PC on Energy and the PC on Cooperative Governance and Traditional Affairs for the opportunity afforded to make this presentation