Download
1 / 1
10 likes | 92 Views
Modelling the response of wheat canopy assimilation to CO 2 using two models of different level of empiricism. D Rodriguez 1,2 , F Ewert 3 , J Goudriaan 1 , JR Porter 3 , R Manderscheid 4 , S Burkart 4 , RAC Mitchell 5 & HJ Weigel 4

E N D
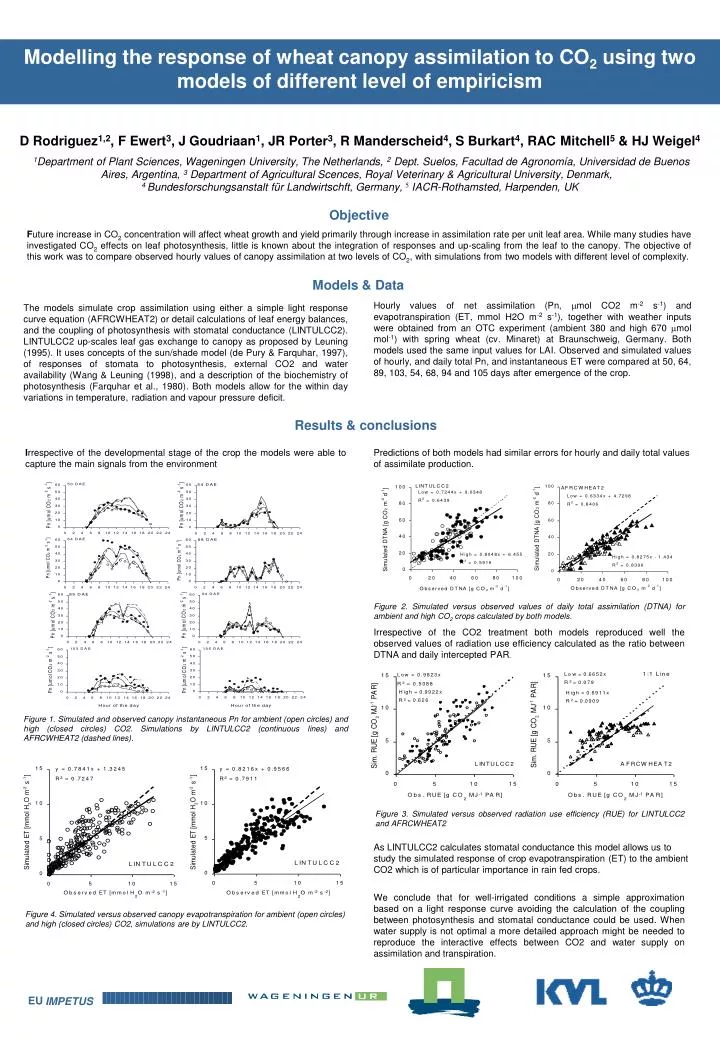
Modelling the response of wheat canopy assimilation to CO2 using two models of different level of empiricism D Rodriguez1,2, F Ewert3, J Goudriaan1, JR Porter3, R Manderscheid4, S Burkart4, RAC Mitchell5 & HJ Weigel4 1Department of Plant Sciences, Wageningen University, The Netherlands, 2 Dept. Suelos, Facultad de Agronomía, Universidad de Buenos Aires, Argentina, 3 Department of Agricultural Scences, Royal Veterinary & Agricultural University, Denmark, 4 Bundesforschungsanstalt für Landwirtschft, Germany,5IACR-Rothamsted, Harpenden, UK Objective Future increase in CO2 concentration will affect wheat growth and yield primarily through increase in assimilation rate per unit leaf area. While many studies have investigated CO2 effects on leaf photosynthesis, little is known about the integration of responses and up-scaling from the leaf to the canopy. The objective of this work was to compare observed hourly values of canopy assimilation at two levels of CO2, with simulations from two models with different level of complexity. Models & Data Hourly values of net assimilation (Pn, mol CO2 m-2 s-1) and evapotranspiration (ET, mmol H2O m-2 s-1), together with weather inputs were obtained from an OTC experiment (ambient 380 and high 670 mol mol-1) with spring wheat (cv. Minaret) at Braunschweig, Germany. Both models used the same input values for LAI. Observed and simulated values of hourly, and daily total Pn, and instantaneous ET were compared at 50, 64, 89, 103, 54, 68, 94 and 105 days after emergence of the crop. The models simulate crop assimilation using either a simple light response curve equation (AFRCWHEAT2) or detail calculations of leaf energy balances, and the coupling of photosynthesis with stomatal conductance (LINTULCC2). LINTULCC2 up-scales leaf gas exchange to canopy as proposed by Leuning (1995). It uses concepts of the sun/shade model (de Pury & Farquhar, 1997), of responses of stomata to photosynthesis, external CO2 and water availability (Wang & Leuning (1998), and a description of the biochemistry of photosynthesis (Farquhar et al., 1980). Both models allow for the within day variations in temperature, radiation and vapour pressure deficit. Results & conclusions Irrespective of the developmental stage of the crop the models were able to capture the main signals from the environment.. Predictions of both models had similar errors for hourly and daily total values of assimilate production. Figure 2. Simulated versus observed values of daily total assimilation (DTNA) for ambient and high CO2 crops calculated by both models. Irrespective of the CO2 treatment both models reproduced well the observed values of radiation use efficiency calculated as the ratio between DTNA and daily intercepted PAR. Figure 1. Simulated and observed canopy instantaneous Pn for ambient (open circles) and high (closed circles) CO2. Simulations by LINTULCC2 (continuous lines) and AFRCWHEAT2 (dashed lines). Figure 3. Simulated versus observed radiation use efficiency (RUE) for LINTULCC2 and AFRCWHEAT2 As LINTULCC2 calculates stomatal conductance this model allows us to study the simulated response of crop evapotranspiration (ET) to the ambient CO2 which is of particular importance in rain fed crops. We conclude that for well-irrigated conditions a simple approximation based on a light response curve avoiding the calculation of the coupling between photosynthesis and stomatal conductance could be used. When water supply is not optimal a more detailed approach might be needed to reproduce the interactive effects between CO2 and water supply on assimilation and transpiration. Figure 4. Simulated versus observed canopy evapotranspiration for ambient (open circles) and high (closed circles) CO2, simulations are by LINTULCC2. EU IMPETUS