Download
1 / 31
310 likes | 402 Views
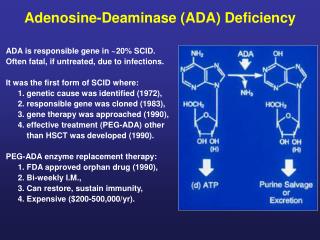
Early Experiences with KTAU on the IBM Blue Gene / L. A. Nataraj, A. Malony, A. Morris, S. Shende {anataraj,malony,sameer,amorris}@cs.uoregon.edu Performance Research Lab University of Oregon. Outline. Motivations Objectives ZeptoOS project KTAU Architecture KTAU on Blue Gene / L

E N D
Early Experiences with KTAU on the IBM Blue Gene / L A. Nataraj, A. Malony, A. Morris, S. Shende {anataraj,malony,sameer,amorris}@cs.uoregon.edu Performance Research Lab University of Oregon
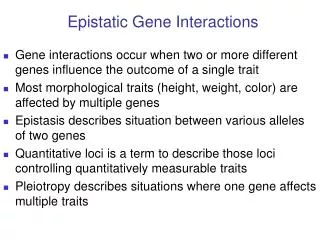
Outline • Motivations • Objectives • ZeptoOS project • KTAU Architecture • KTAU on Blue Gene / L • Experiments and experience • KTAU improvements • Future work • Acknowledgements
Motivation • Application performance is a consequence of • User-level execution • OS-level operation • Good tools exist for observing user-level performance • User-level events • Communication events • Execution time measures • Hardware performance • Fewer tools exist to observe OS-level aspects • Ideally would like to do both simultaneously • OS-level influences on application performance
Scale and Performance Sensitivity • HPC systems continue to scale to larger processor counts • Application performance more performance sensitive • OS factors can lead to performance bottlenecks[Petrini’03, Jones’03, …] • System/application performance effects are complex • Isolating system-level factors is non-trivial • Require comprehensive performance understanding • Observation of all performance factors • Relative contributions and interrelationship • Can we correlate OS and application performance?
Phase Performance Effects Waiting timedue to OS Overhead accumulates
Program - OS Interactions • Program OS Interactions • Direct • applications invoke the OS for certain services • syscalls and internal OS routines called from syscalls • Indirect • OS operations without explicit invocation by application • preemptive scheduling (other processes) • (HW) interrupt handling • OS-background activity • keeping track of time and timers, bottom-half handling, … • can occur at any OS entry
Program - OS Interactions (continued) • Direct interactions easier to handle • Synchronous with user-code • In process-context • Indirect interactions more difficult • Usually asynchronous • Usually in interrupt-context • Harder to measure • where are the boundaries? • Harder to correlate and integrate with application measurements
Performance Perspectives • Kernel-wide • Aggregate kernel activity of all active processes • Understand overall OS behavior • Identify and remove kernel hot spots • Cannot show application-specific OS actions • Process-centric • OS performance in specific application context • Virtualization and mapping performance to process • Programs, daemons, and system services interactions • Expose sources of performance problems • Tune OS for specific workload and application for OS
Existing Approaches • User-space only measurement tools • Many tools only work at user-level • Cannot observe system-level performance influences • Kernel-level only measurement tools • Most only provide the kernel-wide perspective • lack proper mapping/virtualization • Some provide process-centric views • cannot integrate OS and user-level measurements
Existing Approaches (continued) • Combined or integrated user/kernel measurement tools • A few tools allow fine-grained measurement • Can correlate kernel and user-level performance • Typically focus only on direct OS interactions • Indirect interactions not normally merged • Do not explicitly recognize parallel workloads • MPI ranks, OpenMP threads, … • Need an integrated approach to parallel performance observation and analyses that support both perspectives
High-Level Objectives • Support low-overhead OS performance measurement at multiple levels of function and detail • Provide both kernel-wide and process-centric perspectives of OS performance • Merge user-level and kernel-level performance information across all program-OS interactions • Provide online information and the ability to function without a daemon where possible • Support both profiling and tracing for kernel-wide and process-centric views in parallel systems • Leverage existing parallel performance analysis tools • Support for observing, collecting and analyzing parallel data
ZeptoOS • DOE OS/RTS for Extreme Scale Scientific Computation • Effective OS/Runtime for petascale systems • Funded ZeptoOS project • Argonne National Lab and University of Oregon • What are the fundamental limits and advanced designs required for petascale Operating System Suites? • Behaviour at large scales • Management and optimization of OS suites • Collective operations • Fault tolerance • OS performance analysis
ZeptoOS and TAU/KTAU • Lots of fine-grained OS measurement is required for each component of the ZeptoOS work • How and why do the various OS source and configuration changes affect parallel applications? • How do we correlate performance data between • OS components • Parallel application and OS • Solution: TAU/KTAU • An integrated methodology and framework to measure performance of applications and OS kernel
ZeptoOS Strategy • “Small Linux on big computers” • IBM BG/L and other systems (e.g., Cray XT3) • Argonne • Modified Linux on BG/L I/O nodes (ION) • Modified Linux for BG/L compute nodes (TBD) • Specialized I/O daemon on I/O node (ZOID) (TBD) • Oregon • KTAU • integration of TAU infrastructure in Linux Kernel • integration with ZeptoOS and installation on BG/L ION • port to other 32-bit and 64-bit Linux platforms
KTAU On BG/L’s ZeptoOS • I/O Node • Open source modified Linux Kernel (2.4, 2.6) • Control I/O Daemon (CIOD) handles I/O syscalls • from compute nodes in process set • Compute Node • IBM proprietary (closed-source) light-weight kernel • No scheduling or virtual memory support • Forwards I/O syscalls to CIOD on I/O node • KTAU on I/O Node • Integrated into ZeptoOS configuration and build system • Require KTAU-D (daemon) (CIOD is closed-source) • KTAU-D periodically monitors KTAU measurements • system-wide or individual process
Early Experiences on BG/L • Validate and verify KTAU system • Show kernel-wide and process-specific perspectives • Run benchmark experiments • Argonne iotest benchmark • MPI-based benchmark (open/write/read/close) • aggregate bandwidth numbers • varying block-sizes, number of nodes, and iterations • observe functional and performance behavior • Apply KTAU to ZeptoOS problems • Accurate identification of “noise” sources • Argonne Selfish benchmark • identify “detours” (noise events) in user-space
Experiment Setup (Parameters) • KTAU: • Enable all instrumentation points • Number of kernel trace entries per proces = 10K • KTAU-D: • System-wide tracing • Accessing trace every 1 second and dump trace output to a file in user’s home directory through NFS • IOTEST: • Running with default parameters (blocksize = 16MB)
CIOD Kernel Profile on I/O Nodes • All instrumentation points enabled except schedule() • Numbers shown are function call counts (profile data) • Compute node running “hello world” sample job • Visualize using TAU’s ParaProf
CIOD Kernel Trace (iotest) 8 compute nodes zoomed view
KTAU Trace of CIOD running 2, 4, 8, 16, 32 nodes sys_read / sys_write 1,769 sys_write As the number of compute node increase, CIOD has to handle larger amount of sys_call being forwarded. 3,142 sys_write 5,838 sys_write 10,980 sys_write 37,985 sys_write
Correlated CIOD Activity with RPCIOD • Switching from CIOD to RPCIOD during a “sys_write” call • RPCIOD performs “socket_send” for NFS read/write and IRQ RPCIOD CIOD
Recent Work on ZeptoOS Project • Accurate Identification of “noise” sources • Modified Linux on BG/L should be efficient • Effect of OS “noise” on synchronization / collectives • What OS aspects induce what types of interference • code paths • configurations • devices attached • Requires user-level and OS measurement • If can identify noise sources, then can remove or alleviate interference
Approach • ANL Selfish benchmark to identify “detours” • Noise events in user-space • Shows durations and frequencies of events • Does NOT show cause or source • Runs a tight loop with an expected (ideal) duration • logs times and duration of detours • Use KTAU OS-tracing to record OS activity • Correlate time of occurrence • uses same time source as Selfish benchmark • Infer type of OS-activity (if any) causing the “detour”
OS/User Performance View of Scheduling preemptivescheduling
KTAU On BG/L (future version) Replace with: Linux + KTAU Replace with: ZOID + TAU
Future Work • Dynamic measurement control • Improve performance data sources • Improve integration with TAU’s user-space capabilities • Better correlation of user and kernel performance • Full callpaths and phase-based profiling • Merged user/kernel traces (already available) • Integration of TAU and KTAU with Supermon • Porting efforts to IA-64, PPC-64, and AMD Opteron • ZeptoOS characterization efforts • BGL I/O node • Dynamically adaptive kernels
Acknowledgements • Department of Energy’s Office of Science • National Science Foundation • University of Oregon (UO) Core Team • Aroon Nataraj, PhD Student • Prof. Allen D Malony • Dr. Sameer Shende, Senior Scientist • Alan Morris, Senior Software Engineer • Suravee Suthikulpanit , MS Student (Graduated) • Argonne National Lab (ANL) Contributors • Pete Beckman • Kamil Iskra • Kazutomo Yoshii