Download
1 / 41
410 likes | 419 Views
Full Waveform LiDAR Understanding full waveform and how it works. Jamie Young Senior Manager-LiDAR Solutions - AeroMetric. History and background What is Full Waveform How does it work Specifications Hardware Process and Software Application comparison. Topics. Benefits Questions?.

E N D
Full Waveform LiDARUnderstanding full waveform and how it works Jamie YoungSenior Manager-LiDAR Solutions - AeroMetric
History and background • What is Full Waveform • How does it work • Specifications • Hardware • Process and Software • Application comparison Topics • Benefits • Questions? Full Waveform
History of full waveform digitizationalmost as old as LIDAR • Capability exists in bathymetric systems • 2d visualization concepts for pseudo-waveform data • Waveform digitizing adapted to terrestrial use • Gaussian waveform decomposition used in Bathymetric systems 2009 Capability available from all major manufacturers LAS 1.3 file format released TerraScan processing of waveform data
Glossary -frequently used terms FWD - Full Waveform Digitization MRI - Multiple Returns with Intensity Minimum returnseparation - minimum range difference for which independent range/intensity measurements can be made Sample depth - resolution of the intensity measurement made at each digitizing interval Sample interval- time interval (usually in nanoseconds) between intensity samples Waveform length -number of samples, or total distance, digitized within the capture waveform
What is Full waveform? • The laser pulse is emitted and all the return information of that pulse is received back to the receiver and stored. • The system needs to be set up to store the amount of information desired • 64 samples • 128 samples • 256 samples • The return information needs to be converted to usable data • Basically, the full waveform data is converted to discrete return information
What technology is used? • The systems used are the same as what is used for traditional LiDAR sensors with one exception. • A full waveform digitizer • GPS • IMU • Laser • Scanner
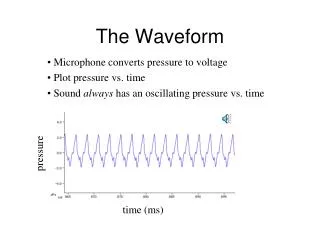
Footprint Return waveform is generated by all reflective surfaces within the laser footprint LIDAR waveformhow is it created? • Multiple return pulses are generated as the laser pulse hits various levels in the forest canopy, creating in total a complete return waveform • Waveform measurement is a natural extension of the conventional “discrete-return + intensity” measurement process
Laser Footprint Start Pulse Detector Signal Tn , In T1 , I1 Full Waveform Digitization (FWD) basic concept
LIDAR waveform visualization • Each output laser pulse will hit a unique combination of surfaces on the terrain below: • Different elevation • Different percent of footprint intercepted at each foliage level • Different reflectivity of intercepted surfaces • Each output laser pulse will result in a unique waveform shape PULSE 4 PULSE 5 Pulse 3 PULSE 1 PULSE 2
What is Full Waveform Digitization?capturing the complete return, not just the peaks • Conventional discrete return electronics capture only the exact time of the peaks of independently-recognized return pulses • Peak intensity is also measured • In FWD systems, the entire return signal is measured, allowing capture of subtle deviations in the shape of the reflected pulse as compared to the shape of the outbound laser pulse Discrete Returns Waveform
Exploiting individual waveformsGaussian decomposition for finding “buried” data • Gaussian decomposition • Return signal from ground • Return signal digitized at user-selected interval (typically 1 ns; equivalent to ~15 cm height) • Fitting of first return Gaussian component • Fitting of second Gaussian component • Fitting of third Gaussian component • Note: Each Gaussian component must be fitted for: • Time of occurrence • Peak amplitude • Pulse width • Benefit: any “stretching” of pulse detected can be used to indicate vegetation height on ground (and automatic adjustment of range) or inclined surfaces
AeroMetric (Leica ALS-70) SpecificationsWDM65 Waveform Digitizer Module
Operating envelopemax waveform rate versus slant range • At pulse rates below 120 kHz, waveforms captured at laser pulse rate • At pulse rates above 120 kHz, waveforms capture for every other pulse, up to 200 kHz (150 kHz for ALS50-II)
Hardware configurationfull waveform digitizing for ALS • Upcoming release – announce 17 Nov 2009 • Core is new “FWD-ready” Data Logger Module (DLM65) – installed in all new ALS60 systems • Existing HDD replaced by 160 GB SATA SSD (MM60) and allows missions up to 7620 m AMSL equivalent cabin pressure • 3 variations • Option on new ALS60 (771706) • Upgrade on fielded ALS60 (771708) • Upgrade on fielded ALS50-II (773668 + 771707) • Waveform viewer software + ALSPP data output in LAS 1.3 format
Hardware detailsDLM65 / digitizer kit • DLM65 chassis • Waveform Interface PCB added to System Controller tray (signal splitter) • Double-wide CPU replaced with faster single-wide CPU with on-board SATA driver (releases 2 slots) • Slot Blocker • Existing 32-bit DIO PCB for System Controller data logging remains • FWD kit • 2x waveform digitizer PCB (60 kHz max each) • 1x time synchronizer PCB • Firmware license • DLM Power supply hard mounted to card cage (releases 2 slots) • Baffle to direct airflow
Some points about FWD • Intensities must be digitized at <2 ns intervals to minimize aliasing, though 1 ns more common • 1 ns in time represents 0.15 m in range (i.e., elevation) • Signal amplitude at each interval typically digitized at 8-bit resolution (i.e., one byte) • Therefore, 256 additional bytes of waveform data needed to digitize the return waveform from a 38.4 meter-tall object @ 1 ns intervals • Range data is still be measured independently to achieve typical 1.5 cm (i.e., 100 ps) range resolution
Using waveform data for classification concept • Assumes that waveform shape/content, as opposed to mere extraction of equivalent discrete returns, is used to classify object which reflected laser pulse • Assumes that waveform is compared to a “catalog” of “typical” waveforms for different target classes
FWD post processing Overview • ALS Post Processor • Support is available. v2.73 #2 (or greater) • Outputs LAS 1.3 type 4 files • Wave Viewer Utility. v1.0.0.4 (or greater) • Simple LAS 1.3 Waveform file viewer • TerraScan (See other CSS workflow documentation for details) • Support for LAS 1.3 released Oct ’09. v9.14 (on www.terrasolid.fi) • The following features are included: • View waveform data for a selected point in the point cloud • Scan the waveform for returns that were too close together for the discrete-ranging electronics to detect or because the returns were below the threshold discriminator (i.e., creates a new “discrete” return) • No other calibration needed
FWD - flight planning • No support for waveform data collection in FPES initially (i.e., waveform capture settings must be manually entered in FCMS) • Four settings control system configuration for waveform capture • Pre-trigger samples (configured in FCMS hardware configuration) • Number of samples • Sample interval • Maximum pulse rate • Options can be preconfigured or changed during flight execution
FWD - TracGUI real-time waveform display Waveforms are shown in this display, in flight, while on- line using F4 F4 W command
Classification flowchart Load sample waveform Sample waveform Load next target waveform Target waveform 1 Compare sample waveform to target waveform Target waveform 2 Assign class Match? Yes No Target waveform 3 Any target samples left? No match Yes No
Data outputwaveform viewing and access • Wave Viewer • Main statistics (sample rate, waveform depth, waveform sequence number, timing data) • Allows scrolling through entire captured series of waveforms • Displays waveform • Displays time/intensity indicator (2 black boxes near waveform peaks) from discrete-return data collection that operates in parallel with waveform capture • TerraScan • Waveform display associated with any given discrete-return point • Future expansion allows possible improvement by deriving additional parameter (pulse stretch) in pre-processing and passing these on to TerraScan for more efficient//accurate filtering
FWD - ALS Post Processor/ing • Select “Process Waveform Data” option. • Software looks for “RawWfd” folder with matching mission ID. • Automatically output LAS 1.3 file for each flight line
FWD - Wave Viewer • X-axis: sample (number), time (ns) or range (m) • Y–axis: signal strength (volts or counts) • Used to review data and confirm that waveform data is correctly correlated with discrete-return data
FWD - post processing: Wave Viewer • In this example, two returns were missed by the discrete-return ALS range electronics • The first missed pulse was too close to the first pulse to be seen • The second missed pulse was too small to be seen.
FWD - post processing: intensity scale • Note: Y scale factor of the raw intensity values and the waveform digitized values are not the same. • Intensity PCB in the SCM is designed to use the full 8-bits for the typical signal amplitudes • The waveform digitizer PCB has limited configuration options so the the option closest to the Intensity PCB scale factor is used • The intensity board uses the following scale (latest revision only, earlier versions may have different scale factors): • 0.110V signal = 10 counts • 3.7V signal = 250 counts • The waveform digitizers use the following scale: • 0 V = 0 counts • 4.1V = 255 counts
FWD - post processing: sample files • Sample LAS 1.3 files will be located on FTP site • Contents • Wave Viewer • LAS 1.3 file format specification (can be released to public) • Data set • Note: Contact PM for FTP information
FWD - post processingTerraScan capabilities • Viewing of waveform profile when clicking on discrete points in the point cloud • Mensurating more discrete returns from WF data (“extract echos” feature)
FWD -TerraScan V10.17+ “Extract Echoes” feature • Allows extraction of small signals via user-adjustable “ambient noise” threshold • Allows extraction of returns at less than the minimum separation dictated by discrete-return electronics (see cyan-colored points below)
Using waveform data for classification caveats • Each return waveform highly dependent on • Specific geometry (i.e., portion of laser footprint intercepted at different heights above ground) • Reflectivity of each surface intercepting a portion of the laser footprint • Therefore • Waveforms returned from a group of nearby laser shots may have to be averaged to arrive at a more consistent “typical” waveform for comparison to the target waveform library • Waveforms to be averaged must be referenced to some consistent key point (e.g., ground level) before averaging, in order to generate a meaningful comparison
MRI and FWD provide some similar functionality • FWD exploitation techniques can extract returns that are “buried” • FWD waveforms from a group of adjacent laser shots may need to be averaged to make automated classification feasible • Averaging MRI “pseudo-waveforms” from a group of adjacent laser shots may be an effective alternative to FWD, especially if • LIDAR system can measure intensity for a large enough number of returns for each outbound laser pulse (e.g., 3+) • Inter-return minimum separation distance is small enough (target dependent) • High point density in MRI systems helps to overcome the additional per-pulse information supplied by FWD systems • Some applications may be accomplished by both methods, but may be better suited to one or the other (see table)
Benefits of FWDgetting more from a single flight • Present • Extraction of points below the discrimination threshold of discrete-return electronics (weak returns) • Extraction of points with smaller vertical separation than detectable by discrete-return electronics (close, but not overlapping pulses) • Future • Detection of pulse stretching (return pulse wider than laser pulse) indicating • Potentially sloped surfaces • Low vegetation on ground, indicating need to adjust point elevation downward • Improved classification by using combination of return pulse width and spatial context • Indication of biomass by evaluating area contained under the pulse shape
WILDER LiDAR Blog http://bloglidar.wordpress.com
Thank You Thank You to Leica for Contributions to this presentation