Download

1 / 14
170 likes | 291 Views
Systems of Inequalities. Section 6.5 College Algebra, MATH 171 Mr. Keltner. Linear Inequalities. A linear inequality in two variables can be written in any one of these forms: Ax + By < C Ax + By > C Ax + By ≤ C Ax + By ≥ C

E N D
Systems of Inequalities Section 6.5 College Algebra, MATH 171 Mr. Keltner
Linear Inequalities • A linear inequality in two variables can be written in any one of these forms: • Ax + By < C • Ax + By > C • Ax + By ≤ C • Ax + By ≥ C • An ordered pair (x, y) is a solution of the linear inequality if the inequality is true when x and y are substituted into the inequality.
Example 1 • Which ordered pair is a solution of 5x - 2y ≤ 6? • (0, -3) • (5, 5) • (1, -2) • (3, 3)
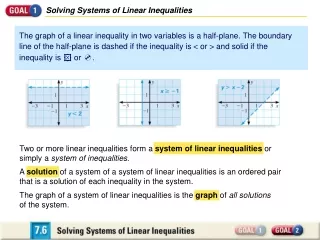
Graphing Linear Inequalities • The graph of a linear inequality is the set of all points in a coordinate plane that represent solutions of the inequality. • We represent the boundary line of the inequality by drawing the function represented in the inequality. • The boundary line will be a: • Solid line when ≤ and ≥ are used. • Dashed line when < and > are used. • Our graph will be shaded on one side of the boundary line to show where the solutions of the inequality are located.
Graphing Linear Inequalities Here are some steps to help graph linear inequalities: • Graph the boundary line for the inequality. Remember: • ≤ and ≥ will use a solid curve. • < and > will use a dashed curve. • Test a point NOT on the boundary line to determine which side of the line includes the solutions. (The origin is always an easy point to test, but make sure your line does not pass through the origin) • If your test point is a solution, shade THAT side of the boundary line. • If your test points is NOT a solution, shade the opposite side of the boundary line.
y 5 x -5 -5 5 Example 2 • Graph the inequality x ≤ 4 in a coordinate plane. • HINT: Remember HOY VEX. • Decide whether to use a solid or dashed line. • Use (0, 0) as a test point. • Shade where the solutions will be.
y 5 x -5 -5 5 Example 3 • Graph 3x - 4y > 12 in a coordinate plane. • Sketch the boundary line of the graph. • Find the x- and y-intercepts and plot them. • Solid or dashed line? • Use (0, 0) as a test point. • Shade where the solutions are.
Systems of Inequalities • Graphing a system of inequalities is just the same as we would graph a single inequality. • The solution of such a system is the set of all points that are solutions to every inequality in the system. • We use the same ideas about solid and dashed lines and shading as we have before. • It is helpful to have strategies in mind to find the intersection point of individual graphs.
y 5 x -5 -5 5 Example 4 • Graph the solution of the system of inequalities. • What shape is each graph? • Solid or dashed lines? • Sketch each graph. • Use a test point to decide where to shade.
System of Linear Inequalities • As mentioned earlier, we can easily recognize a linear inequality. • In the next example, we will graph the solution set of a system of linear inequalities. • Even if the directions do not ask us to do so, we have methods that allow us to find the vertices (corners, or intersection points) of the shaded region.
Graph the solution set of the system, and label its vertices. y 5 x -5 -5 5 Example 5
Details About Systems • When a shaded region is enclosed within a particular-sized region, it is considered to be a bounded region. • A region that is NOT enclosed (not bounded) is called an unbounded region. • In practical applications, we find that many problems will involve constraints on the variables. • A farmer only having a certain acreage to plant crops in • A store manager only having a set number of employees to work • A person’s age, weight, or height (nonnegative) • When dealing with applied inequalities like these, the solution set is usually referred to as the feasible region, because the points represent feasible values for the variables at hand.
Example 6 • A publishing company publishes a total of no more than 100 books a year. At least 20 of these are nonfiction, but the company always publishes at least as much fiction as nonfiction. Find the system of inequalities that describes the possible numbers of fiction and nonfiction books that the company can produce each year, consistent with these policies. • Sketch a graph of the feasible region, labeling the vertices.
Assessment Pgs. 479-480: #’s 9-45, multiples of 9