Download
1 / 14
140 likes | 157 Views
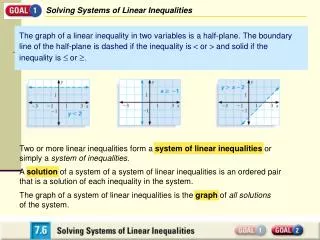
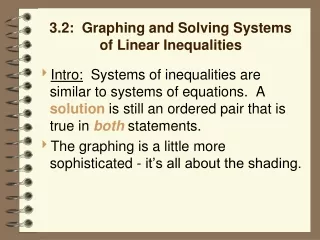
Solving Systems of Linear Inequalities. The graph of a linear inequality in two variables is a half-plane. The boundary line of the half-plane is dashed if the inequality is < or > and solid if the inequality is £ or ³.

E N D
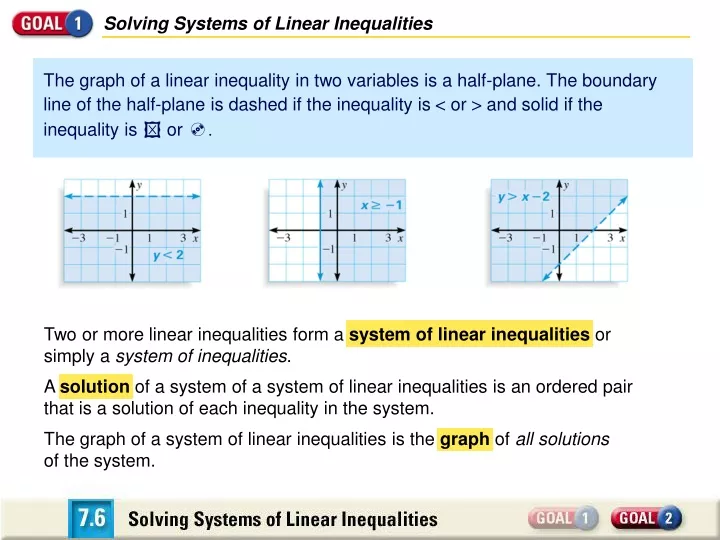
Solving Systems of Linear Inequalities The graph of a linear inequality in two variables is a half-plane. The boundary line of the half-plane is dashed if the inequality is < or > and solid if the inequality is £or ³. Two or more linear inequalities form a system of linear inequalities or simply a system of inequalities. A solution of a system of a system of linear inequalities is an ordered pair that is a solution of each inequality in the system. The graph of a system of linear inequalities is the graph of all solutions of the system.
A Triangular Solution Region y < 2 Inequality 1 x³ –1 Inequality 2 y> x – 2 Inequality 3 CHECK Graph the system of linear inequalities. SOLUTION Graph all three inequalities in the same coordinate plane. The graph of the system is the overlap, or the intersection, of the three half-planes shown. You can see from the graph that the point (2, 1) is a solution of the system. To check this, substitute the point into each inequality. 1 < 2 True. 2³ –1 True. True. 1 > 2 – 2
A Triangular Solution Region y < 2 Inequality 1 x³ –1 Inequality 2 y> x – 2 Inequality 3 Graph the system of linear inequalities. The point (0, 3) is not in the graph of the system. Notice (0, 3) is not a solution of inequality 1. This point is not a solution of the system. When graphing a system of inequalities, it is helpful to find each corner point (or vertex). For instance, this graph has three corner points:(–1, 2), (–1, –3), and (4, 2).
Solution Region Between Parallel Lines The system of linear inequalities at the right defines the shaded region. y < 3 Inequality 1 Inequality 2 y > 1 Write a system of inequalities that defines the shaded region shown. SOLUTION The graph of one inequality is the half-plane below the line y = 3. The graph of the other inequality is the half-plane above the line y = 1. The shaded region of the graph is the horizontal band that lies between the two horizontal lines, y = 3 and y = 1, but not on the lines.
A Quadrilateral Solution Region Graph the system of linear inequalities. Label each vertex of the solution region. Describe the shape of the region. x³ 0 The graph of the first inequality is the half-plane on and to the right of the y-axis.
A Quadrilateral Solution Region Graph the system of linear inequalities. Label each vertex of the solution region. Describe the shape of the region. x³ 0 y³ 0 The graph of the first inequality is the half-plane on and to the right of the y-axis. The graph of the second inequality is the half-plane on and above of the x-axis.
A Quadrilateral Solution Region Graph the system of linear inequalities. Label each vertex of the solution region. Describe the shape of the region. y£ 2 The graph of the third inequality is the half-plane on and below the horizontal line y=2.
A Quadrilateral Solution Region The graph of the fourth inequality is the half-plane on and below the line 1 2 1 2 x + 3. x + 3. – – y = y£ Graph the system of linear inequalities. Label each vertex of the solution region. Describe the shape of the region. y£ 2 The graph of the third inequality is the half-plane on and below the horizontal line y=2.
A Quadrilateral Solution Region Graph the system of linear inequalities. Label each vertex of the solution region. Describe the shape of the region. The region that lies in all four half-planes is a quadrilateral with vertices at (0, 2), (0, 0), (6, 0), and (2, 2). Note that (0, 3) is not a vertex of the solution region even though two boundary lines meet at that point.
Modeling A Real-Life Problem You are ordering lighting for a theater so the spotlights can follow the performers. The lighting technician needs at least 3 medium-throw spotlights and at least 1 long-throw spotlight. A medium-throw spotlight costs $1000 and a long-throw spotlight costs $3500. The minimum order for free delivery is $10,000. Write and graph a system of linear inequalities that shows how many medium-throw spotlights and long-throw spotlights should be ordered to get the free delivery. Number of medium-throws ³ 3 Verbal Model Number of long-throws ³ 1 Number of medium-throws Price of a medium-throw Number of long-throws Price of a long-throw • • ³ 10,000 + …
Modeling A Real-Life Problem You are ordering lighting for a theater so the spotlights can follow the performers. The lighting technician needs at least 3 medium-throw spotlights and at least 1 long-throw spotlight. A medium-throw spotlight costs $1000 and a long-throw spotlight costs $3500. The minimum order for free delivery is $10,000. Write and graph a system of linear inequalities that shows how many medium-throw spotlights and long-throw spotlights should be ordered to get the free delivery. … Number of medium-throws = x Labels (no units) (no units) Number of long-throws = y Price of a medium-throw =1000 (dollars) (dollars) Price of a long-throw =3500 …
Modeling A Real-Life Problem You are ordering lighting for a theater so the spotlights can follow the performers. The lighting technician needs at least 3 medium-throw spotlights and at least 1 long-throw spotlight. A medium-throw spotlight costs $1000 and a long-throw spotlight costs $3500. The minimum order for free delivery is $10,000. Write and graph a system of linear inequalities that shows how many medium-throw spotlights and long-throw spotlights should be ordered to get the free delivery. … Algebraic Model x³ 3 Inequality 1 y³ 1 Inequality 2 1000x + 3500y³ 10,000 Inequality 3
Modeling A Real-Life Problem You are ordering lighting for a theater so the spotlights can follow the performers. The lighting technician needs at least 3 medium-throw spotlights and at least 1 long-throw spotlight. A medium-throw spotlight costs $1000 and a long-throw spotlight costs $3500. The minimum order for free delivery is $10,000. Write and graph a system of linear inequalities that shows how many medium-throw spotlights and long-throw spotlights should be ordered to get the free delivery. The graph of the system of inequalities is shown. Any point in the shaded region of the graph is a solution to the system. A fraction of a spotlight cannot be ordered, so only ordered pairs of integers in the shaded region will correctly answer the problem.
Modeling A Real-Life Problem You are ordering lighting for a theater so the spotlights can follow the performers. The lighting technician needs at least 3 medium-throw spotlights and at least 1 long-throw spotlight. A medium-throw spotlight costs $1000 and a long-throw spotlight costs $3500. The minimum order for free delivery is $10,000. Will an order of 4 medium-throw spotlights and 1 long-throw spotlight be delivered free? The point (4, 1) is outside the solution region, so an order of 4 medium-throw spotlights and 1 long-throw spotlight would not be delivered free.