Download
1 / 22
220 likes | 328 Views
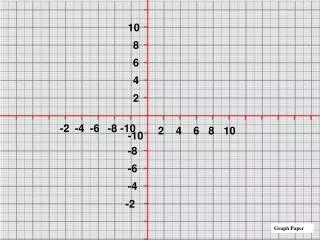
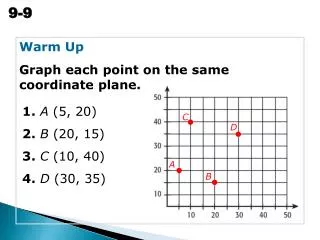
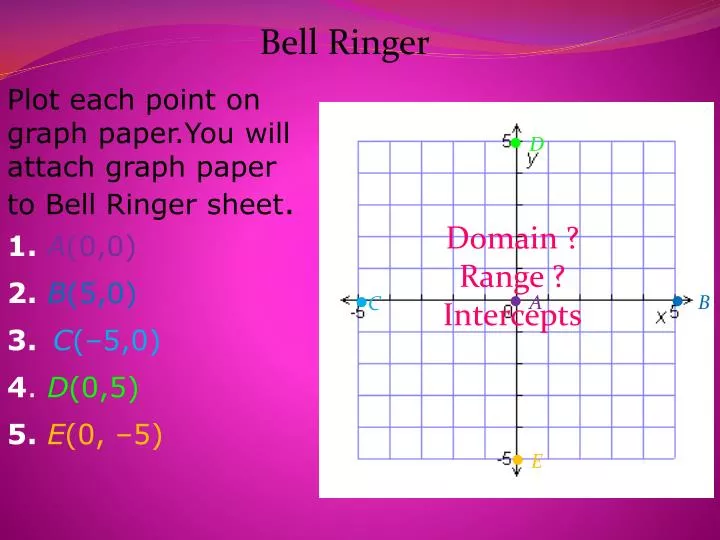
Bell Ringer. Plot each point on graph paper.You will a ttach graph paper to Bell Ringer sheet . 1. A (0,0) 2. B (5,0) 3. C (–5,0) 4 . D (0,5) 5. E (0, –5). D. Domain ? Range ? Intercepts. C. A. B. E.

E N D
Bell Ringer Plot each point on graph paper.You will attach graph paper to Bell Ringer sheet. 1. A(0,0) 2.B(5,0) 3.C(–5,0) 4. D(0,5) 5.E(0, –5) D Domain ? Range ? Intercepts C A B E
Chapter 1(1) Apply transformations to different families of functions. (2) Fit data to linear models. Holt McDougal Common Core Edition 1.1 1.4 F-IF.6 A-REI.1 F-BF.3
Chapter 1 Vocabulary:suggestion: pick one color per word and definition. Copy words for Bell Ringer on Bell Ringer sheet Due: 28th, Test 1 Date Correlation Slope Reflection Regression Stretch Transformation vs. Translation Parent Function
Slope tree positive negative undefined
Example: Translating Points Perform the given translation on the point (–3, 4). Give the coordinates of the translated point. 5 units right (-3, 4) (2, 4) Translating (–3, 4) 5 units right results in the point (2, 4). ? Slope ? ? Domain ? ? Range ?
2 units 3 units (–5, 1) Example: Translating Points Perform the given translation on the point (–3, 4). Give the coordinates of the translated point. 2 units left and 3 units down (–3, 4) Translating (–3, 4) 2 units left and 3 units down results in the point (–5, 1).
(3, 3) Example: Translation Perform the given translation on the point (–1, 3). Give the coordinates of the translated point. 4 units right Translating (–1, 3) 4 units right results in the point (3, 3). (–1, 3) ? Slope ?
(–2, 1) Example: Translation Perform the given translation on the point (–1, 3). Give the coordinates of the translated point. 1 unit left and 2 units down 1 unit (–1, 3) Translating (–1, 3) 1 unit left and 2 units down results in the point (–2, 1). 2 units ? Slope ?
Notice that when you translate left or right, the x-coordinatechanges, and when you translate up or down, the y-coordinate changes.
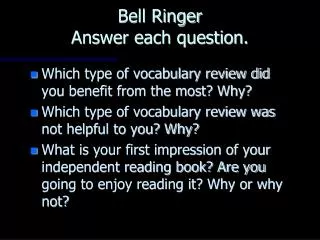
Bell Ringer Using complete sentence, correlate the “h” and “k” to “x” and “y”.
ACT vocabulary You can transform a function by transforming its ordered pairs. When a function is translated or reflected, the original graph and the graph of the transformation are congruent because the size and shape of the graphs are the same.
Activity Start 4 page packet You need to be responsible and keep up with it We will work on each day It is not homework yet
You graphed y=x on a graphing calculator by pressing y= and entering y1=x. Then pressed graph. Then you entered and graphed y2 = x + 5. Next you entered and graphed y3= x – 5. Exit Question: How does the term congruent explain how a change in the value of k in the equation y=x + k affects the equation’s graph. Exit Question
Bell Ringer On graph paper. You may use the same piece from yesterday’s Bell Ringer. Perform the given translation on the point (-3, 4). Indicate the coordinates of the translated point. This is two different translations. a) 5 units right b) 2 unit left and 2 units down
Example Up is K value K is your Y translation 2 units up Identify important points from the graph and make a table. ? (green)Slope(s) ? X Y Y+ 2 -5 -3 -3 + 2 = -1 -2 0 0 + 2 = 2 0 -2 -2 + 2 = 0 2 0 0 + 2 = 2 5 -3 -3 + 2 = -1 Add 2 to each y-coordinate. Team of no more than 2; winning group gets prize! The entire graph shifts 2 units up.
Example Use a table to perform the transformation of y = f(x). Use the same coordinate plane as the original function. What axis are you changing Id key points on original graph Plot new ordered pairs steps translation 3 units right Add 3 to each x-coordinate. What did you do? What happened? The entire graph shifts 3 units right.
Steps?? Example Use a table to perform the transformation of y = f(x). Use the same coordinate plane as the original function. reflection across x-axis f Multiply each y-coordinate by –1. The entire graph flips across the x-axis.
Example Business Application Read only The graph shows the cost of painting based on the number of cans of paint used. Sketch a graph to represent the cost of a can of paint doubling, and identify the transformation of the original graph that it represents. If the cost of painting is based on the number of cans of paint used and the cost of a can of paint doubles, the cost of painting also doubles. This represents a vertical stretch by a factor of 2.
Application: Chess Translation, one per team of twohomework: finish packet, due tomorrow
Exit Question: complete on graph paper. Perform each transformation of y = f(x). Use the same coordinate plane as the original function. Copy the original function. Create a table. You can do all on graph paper a) Translate 2 units up b) Reflection across x axis