Download
1 / 3
30 likes | 173 Views
Graph to plot anthropometric indices against reference population. This graph provides the normal distribution for z scores. To plot your anthropometric curves you need to follow these steps: Double click on the table to see the data sheet (see below).

E N D
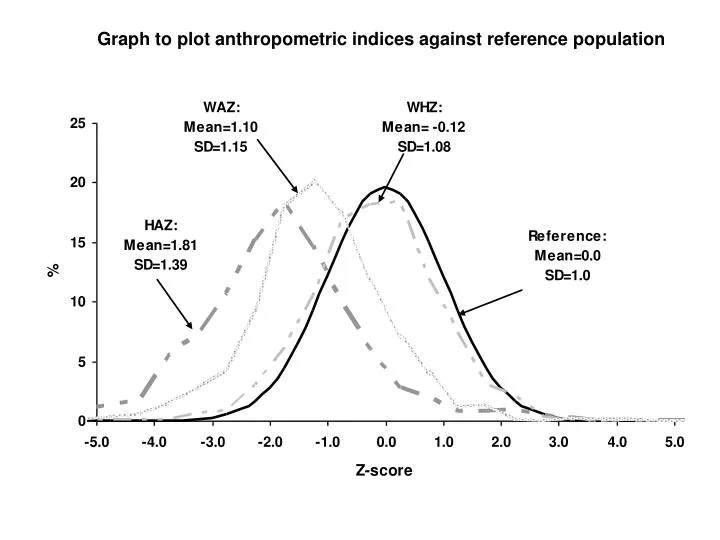
Graph to plot anthropometric indices against reference population
This graph provides the normal distribution for z scores. • To plot your anthropometric curves you need to follow these steps: • Double click on the table to see the data sheet (see below) 2) You will need to summarize the data into the 24 z-score categories. See the next slide for and example of an SPSS program to create the categories. 3) Type in your percentages into the Powerpoint Datasheet – do not change the “reference” percentages
Example SPSS Code • * For a Z-score distribution . • * HAZ . • RECODE • haz • (-6.0 throu -5.5=-5.75) • (-5.5 thru -5.0=-5.25) • (-5.0 thru -4.5=-4.75) • (-4.5 thru -4=-4.25) • (-4 thru -3.5=-3.75) • (-3.5 thru -3=-3.25) • (-3 thru -2.5=-2.75) • (-2.5 thru -2=-2.25) • (-2 thru -1.5=-1.75) • (-1.5 thru -1=-1.25) • (-1 thru -.5=-.75) • (-.5 thru 0=-0.25) • (.0001 thru .5=.25) • (.5001 thru 1=.75) • (1.0001 thru 1.5=1.25) • (1.5001 thru 2=1.75) • (2.0001 thru 2.5=2.25) • (2.5001 thru 3=2.75) • (3.0001 thru 3.5=3.25) • (3.5001 thru 4.0=3.75) • (4.0001 thru 4.5=4.25) • (4.5001 thru 5.0=4.75) • (5.0001 thru 5.5=5.25) • (5.5001 thru 6.0=5.75) • INTO haz_grps . • VARIABLE LABELS haz_grps 'HAZ Groups'. • EXECUTE .