Download
1 / 19
190 likes | 193 Views
Quantitative Methods – Week 3: Correlation. Roman Studer Nuffield College roman.studer@nuffield.ox.ac.uk. Review and Homework. Speed and work load Are we advancing too fast? How much time you devote to this course? Is it too technical, too mathematical?

E N D
Quantitative Methods – Week 3: Correlation Roman Studer Nuffield College roman.studer@nuffield.ox.ac.uk
Review and Homework • Speed and work load • Are we advancing too fast? • How much time you devote to this course? • Is it too technical, too mathematical? • This week’s and next week’s program • No new theory! • Review and apply what we have learnt so far • Look at how authors use descriptive statistics and correlation in their research • Get more practise with Stata • Discussing problem set 1 • Any remaining questions?
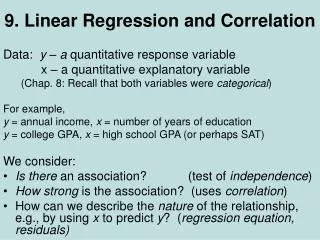
From Descriptive Statistics to Correlation Analysis • When doing descriptive statistics, we were looking at 1 variable at the time, describing its distribution, its central tendency and its spread • Now, we are moving on as week now look at 2 variables at the time, asking whether and how these two variables are associated: • Are two phenomena (variables) linked? • How are they associated (positively/negatively)? • How strong is the association?
Step 1: Graphic Analysis • As with descriptive statistics, we first want to get a visualisation, using a graph • With correlation analysis, we use scatterplots, where one variable is measured on the vertical axis, and the other on the horizontal axis • Example: Poor Law data set: Is the amount of relief payments associated with the level of unemployment?
Step 2: Numeric Analysis • As with descriptive statistics, graphs do not yield precise results, so we again want some precise number that summarises the characteristics of the data, or, in this case, the association between two variables • The “number” that describes the linear association between any two variables is the correlation coefficient • The correlation coefficient, r, is defined as: • r measures the direction and the strength of the association • In contrast to the covariance, the Pearson correlation coefficient is independent of the unit of measurement • r ranges from -1.0 to +1.0
Step 2: Numeric Analysis (II) • Interpretation • +1: perfect positive correlation • - 1: perfect negative correlation • 0: lack of correlation • The closer r is to either +1 or -1, the stronger the relationship • Example: Association between relief payments and unemployment • Correlation coefficient r: + 0.44 • Positive association • Moderate association
Strength of the Association between Variables (I) Example: GDP per person and purchasing power around the world, 2007 • Very strong association • Is to be expected, as concepts are closely related • Positive correlation • r = 0.95
Strength of the Association between Variables (II) Example: Election in Weimar Germany, 1932 • Are the level of unemployment and the support of the Nazi party linked? • Quite strong association • Especially given that The connection is far from obvious • Positive correlation • r = 0.63
Strength of the Association between Variables (III) Example: Election in Weimar Germany, 1932 • Were Catholics more likely to vote for the Nazis? • Moderate association • Pattern not very clear • Negative correlation • r = - 0.34
Strength of the Association between Variables (IV) Example: Election in Weimar Germany, 1932 • Was there a connection between unemployment and the proportion of Catholics in a district? • No discernible association • r = - 0.03 • Correlation coefficient close to 0
Caution when Interpreting Correlation Results • Correlation is NOT causation!! • Causation is very hard to ascertain in social sciences • Beware of spurious or nonsense correlation! Examples: • Simultaneous decline of birth rates and of the number of storks in Sweden • Positive correlation between shoe size and income level • Omitted variables are one of the big problems in econometrics
Caution when Interpreting Correlation Results (II) • Watch out for the influence of outliers on the correlation results!! Example: GDP per person and purchasing power around the world, 2007 • Very strong association • Positive correlation • r = 0.95 • Just 2 outliers • Weak association suggested • r = 0.34
Computer Class: • Descriptive Statistics (II) • Correlation
Data Set: Global Macroeconomic Data • This data set was assembled using the 2007 edition of “Pocket World in Figures”, published by the Economist Notes: • "Agriculture" is the % of GDP from agriculture • "Education" is the % of tertiary enrolment
Exercises • Data set and descriptive statistics • Open Stata and create a new data set from the table on the previous slide (use the data editor!) • Look at each of the variables in turn • Produce histograms: Get a first visualisation of the data; does it look normally distributed? Does it make sense plotting histograms? • Compute the mean, median, standard deviation, coefficient of variation, kurtosis and skewness for every variable • Correlation analysis • Look at the association of “GDP per Head” and “Agriculture” • Make a scatter plot to get a first impression of their association: Do you think these variables are connected? Positively/negatively? • Calculate the correlation coefficient; how would you explain the result? • Look at the association of “GDP per Head” and “Education” • Make a scatter plot to get a first impression of their association: Do you think these variables are connected? Positively/negatively? • Calculate the correlation coefficient; how would you explain the result? • If you look at the scatter plot, are there any outliers? • What happens if you omit the outliers? How could you justify to omit the outliers?
Exercises (II) • Save your data set and your results on the O: drive • Save your new data set as a Stata file (.dta) • Export and save your data set as an Excel file (.xml) • Copy your results and save them in a word file (.doc)
Appendix: STATA Commands • correlate varlist Displays all the pairwise Pearson correlation coefficients between the variables listed after correlate • pwcorr varlist Like correlate, but has some additional options like calculating the significance level • spearman varlist Displays Spearman's rank correlation coefficients for all pairs of variables • scatter varname1 varname2 Produces a scatter plot with variable 1 on the x-axis and variable 2 on the y-axis
Homework • Readings: • Lewitt, Stephen and Stephen Dubner, Freakonomics, chapter 4, “Where Have All the Criminals Gone?”. • Problem Set 2: • Finish the exercises from today’s computer class if you haven’t done so already. Include all the results and aswers in the file you send me • Answer (very briefly) the following questions about Lewitt’s “Where have all the criminals gone?” • List all the variables that Lewitt looks at in the course of the chapter • Many factors (variables) are potentially associated with the drop in crime rates in the US. Where does he find correlations between a variable and the falling crime rate? Which variables are positively, which ones negatively correlated with the crime rate variable? Where does he find no correlation? • In which cases does Lewitt move from correlation to causation? How does he justify this change in language? Is it convincing? • Does this chapter potentially suffer from a omitted variable problem? Of what other factors can you think for explaining the fall in crime rates? • For each potential factor, he provides both the relevant data and some common sense explanation. What do you believe more – the data or the explanations? Why does he need the explanations at all? • Are you convinced by Lewitt’s overall argument? Has the fall in crime rate in the US herewith been explained once and for all?