Download
1 / 64
640 likes | 781 Views
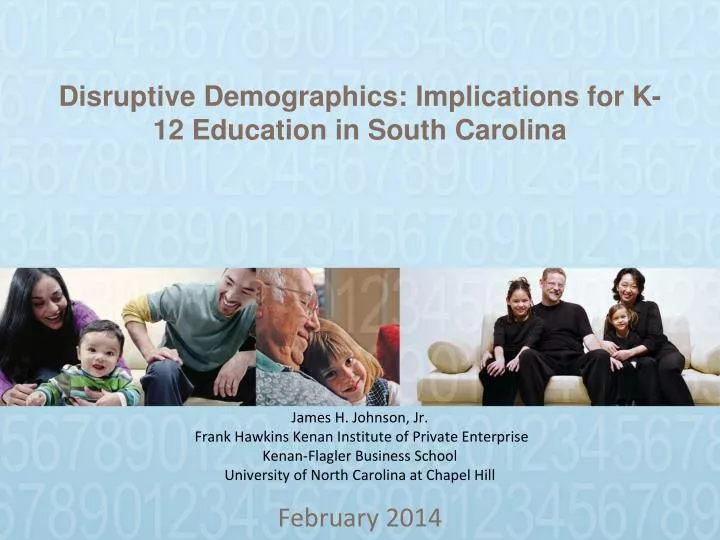
February 2014 . Disruptive Demographics: Implications for K-12 Education in South Carolina . James H. Johnson, Jr. Frank Hawkins Kenan Institute of Private Enterprise Kenan-Flagler Business School University of North Carolina at Chapel Hill. OVERVIEW. Demographic Trends

E N D
February 2014 Disruptive Demographics: Implications for K-12 Education in South Carolina James H. Johnson, Jr. Frank Hawkins Kenan Institute of Private Enterprise Kenan-Flagler Business School University of North Carolina at Chapel Hill
OVERVIEW • Demographic Trends • Challenges & Opportunities • Discussion
CENSUS 2010 what will REVEAL February 2014
6 DISRUPTIVE TRENDS • The South Rises – Again • The Browning of America • Marrying Out is “In” • The Silver Tsunami is About to Hit • The End of Men? • Cooling Water from Grandma’s Well… and Grandpa’s Too!
The South Continues To Rise ...Again!
SOUTH’S SHARE OF U.S. NET POPULATION GROWTH, SELECTED YEARS, 1910-2010
NET MIGRATION TRENDS, 2000-2008 = Net Import = Net Export
Continued Uneven Population Growth in South Carolina, 2010-2012 Dying Counties Growth Magnets Spartanburg Dorchester Beaufort Richland Lexington York Berkeley Greenville Charleston Horry • McCormick • Union • Edgefield • Colleton • Fairfield • Williamsburg • Bamberg • Calhoun • Clarendon • Marlboro • Abbeville • Marion
NON-WHITE AND HISPANIC SHARES OF POPULATION GROWTH, 2000-2010
Marrying Out is “In”
INTERMARRIAGE TREND, 1980-2008 % Married Someone of a Different Race/Ethnicity
INTERMARRIAGE TYPES Newly Married Couples in 2008
MEDIAN AGE OF U.S. POPULATION BY RACE, HISPANIC ORIGIN & GENDER, 2009
Median Age and Fertility Rates for Females in South Carolina, 2007-2011 Fertility/1000 Demographic Group Median Age women* All Females 38.8 56 White, Not Hispanic 42.2 51 Black 34.9 61 American Indian & Alaskan Native 37.4 93 Asian 34.6 49 Native Hawaiian & Pacific Islander 26.5 161 Some other race 24.6 98 Two or more races 16.3 59 Hispanic 24.6 94 Native Born 39.0 55 Foreign Born 37.2 80 Source: www.census.gov *Women 15 to 50 with births in past 12 months.
RELATIVE DISTRIBUTION OF U.S. BIRTHS BY RACE / ETHNICITY Source: Johnson and Lichter (2010); Tavernise (2011).
U.S. POPULATION TURNING 50, 55, 62, AND 65 YEARS OF AGE, (2007-2015)
Absolute and Percent Population Change by Age, 2000-2010 Age United States South Carolina All Ages 27,323,632 613,352 (9.7%) (15.3% ) <25 5,416,292 139,427 (5.4%) (9.8%) 25-44 -2,905,697 7,393 (-3.4%) (0.6%) 45-64 19,536,809 319,991 (31.5%) (34.7%) 65+ 5,276,231 146,541 (15.1%) (30.2%)
DISTRIBUTION OF WIDOWED ELDERLY WOMEN BY COUNTY, THE CAROLINAS, 2010
DISTRIBUTION OF ELDERLY WOMEN LIVING ALONE IN THE CAROLINAS, 2010
DEPENDENCY RATIOS IN THE AMERICAN SOUTH Source: Census 2010
Dependency Ratios for Selected South Carolina Counties [State Ratio = 73.4]
COOLING WATERS FROM GRANDMA’S WELL And Grandpa’s Too!
Children Living in Non-Grandparent and Grandparent Households, 2001-2010
Children Living in Non-Grandparent and Grandparent-Headed Households by Presence of Parents, 2010
JOBS LOST/GAINED BY GENDER DURING 2007 (Q4) – 2009 (Q3) RECESSION
THE PLIGHT OF MEN • Today, three times as many men of working age do not work at all compared to 1969. • Selective male withdrawal from labor market—rising non-employment due largely to skills mismatches, disabilities & incarceration. • The percentage of prime-aged men receiving disability insurance doubled between 1970 (2.4%) and 2009 (4.8%). • Since 1969 median wage of the American male has declined by almost $13,000 after accounting for inflation. • After peaking in 1977, male college completion rates have barely changed over the past 35 years.
UNC SYSTEM STUDENT ENROLLMENT BY GENDER AND TYPE OF INSTITUTION, 2010
Average EOG Scores Gender scores are averages of 6 LEAs (Bertie, Bladen, Halifax, Duplin, Northampton and Pamlico)
Average EOG Scores Gender scores are averages of 6 LEAs (Bertie, Bladen, Halifax, Duplin, Northampton and Pamlico)
Average EOC Scores Gender scores are averages of 6 LEAs (Bertie, Bladen, Halifax, Duplin, Northampton and Pamlico)