Download
1 / 1
10 likes | 154 Views
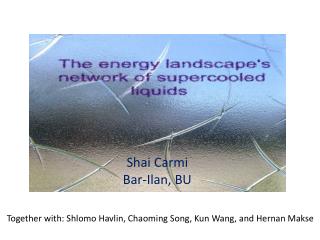
Connectivity and expression in protein networks : Proteins in a complex are uniformly expressed. Shai Carmi 1 , Shlomo Havlin 1 , Erez Levanon 2 , Eli Eisenberg 3

E N D
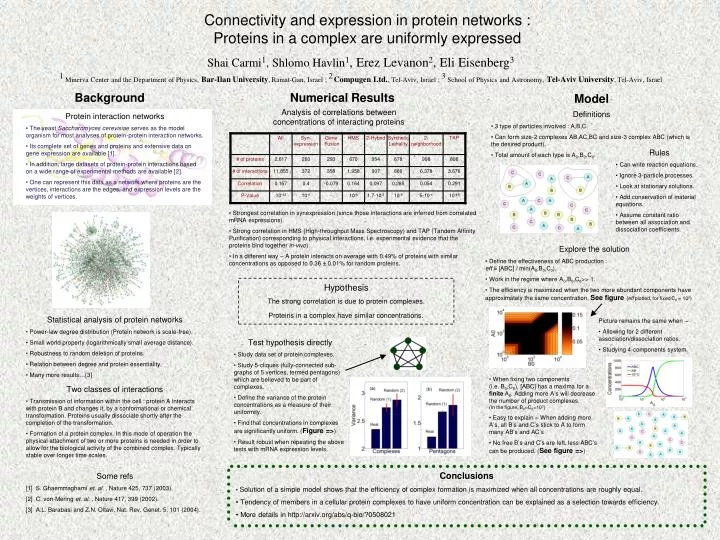
Connectivity and expression in protein networks : Proteins in a complex are uniformly expressed Shai Carmi1, Shlomo Havlin1, Erez Levanon2, Eli Eisenberg3 1 Minerva Center and the Department of Physics, Bar-Ilan University, Ramat-Gan, Israel ; 2Compugen Ltd., Tel-Aviv, Israel ; 3 School of Physics and Astronomy, Tel-Aviv University, Tel-Aviv, Israel Background Numerical Results Model Analysis of correlations between concentrations of interacting proteins • Definitions • 3 type of particles involved : A,B,C. • Can form size-2 complexes AB,AC,BC and size-3 complex ABC (which is the desired product). • Total amount of each type is A0,B0,C0. • Protein interaction networks • The yeast Saccharomyces cerevisiae serves as the model organism for most analyses of protein-protein interaction networks. • Its complete set of genes and proteins and extensive data on gene expression are available [1]. • In addition, large datasets of protein-protein interactions based on a wide range of experimental methods are available [2]. • One can represent this data as a network where proteins are the vertices, interactions are the edges, and expression levels are the weights of vertices. • Rules • Can write reaction equations. • Ignore 3-particle processes. • Look at stationary solutions. • Add conservation of material equations. • Assume constant ratio between all association and dissociation coefficients. • Strongest correlation in synexpression (since those interactions are inferred from correlated mRNA expressions). • Strong correlation in HMS (High-throughput Mass Spectroscopy) and TAP (Tandem Affinity Purification) corresponding to physical interactions, i.e. experimental evidence that the proteins bind together in-vivo). • In a different way – A protein interacts on average with 0.49% of proteins with similar concentrations as opposed to 0.36 ± 0.01% for random proteins. • Explore the solution • Define the effectiveness of ABC production : eff ≡ [ABC] / min(A0,B0,C0). • Work in the regime where A0,B0,C0>> 1. • The efficiency is maximized when the two more abundant components have approximately the same concentration. See figure (eff plotted, for fixed C0 = 102) Hypothesis The strong correlation is due to protein complexes. Proteins in a complex have similar concentrations. • Statistical analysis of protein networks • Power-law degree distribution (Protein network is scale-free). • Small world property (logarithmically small average distance). • Robustness to random deletion of proteins. • Relation between degree and protein essentiality. • Many more results…[3] • Picture remains the same when – • Allowing for 2 different association/dissociation ratios. • Studying 4-components system. • Test hypothesis directly • Study data set of protein complexes. • Study 5-cliques (fully-connected sub-graphs of 5 vertices, termed pentagons) which are believed to be part of complexes. • Define the variance of the protein concentrations as a measure of their uniformity. • Find that concentrations in complexes are significantly uniform. (Figure =>) • Result robust when repeating the above tests with mRNA expression levels. • When fixing two components (i.e. B0,C0), [ABC] has a maxima for a finite A0. Adding more A’s will decrease the number of product complexes.(In the figure, B0=C0=103) • Easy to explain – When adding more A’s, all B’s and C’s stick to A to form many AB’s and AC’s • No free B’s and C’s are left, less ABC’s can be produced. (See figure =>) • Two classes of interactions • Transmission of information within the cell : protein A interacts with protein B and changes it, by a conformational or chemical transformation. Proteins usually dissociate shortly after the completion of the transformation. • Formation of a protein complex. In this mode of operation the physical attachment of two or more proteins is needed in order to allow for the biological activity of the combined complex. Typically stable over longer time scales. • Conclusions • Solution of a simple model shows that the efficiency of complex formation is maximized when all concentrations are roughly equal. • Tendency of members in a cellular protein complexes to have uniform concentration can be explained as a selection towards efficiency. • More details in http://arxiv.org/abs/q-bio/?0508021 Some refs [1] S. Ghaemmaghami et. al. , Nature 425, 737 (2003). [2] C. von-Mering et. al. , Nature 417, 399 (2002). [3] A.L. Barabasi and Z.N. Oltavi, Nat. Rev. Genet. 5, 101 (2004).