Download
1 / 18
190 likes | 264 Views
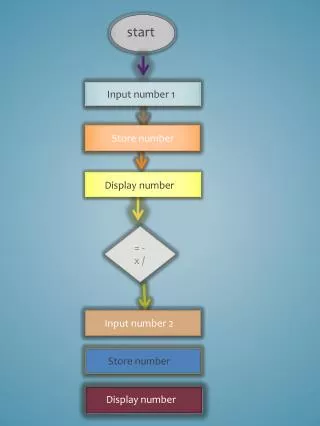
Frequency Distribution Table (grouped). start. What it is. Why and how to Group. Terminology. How to create one. What it is. A Frequency Distribution table will show the frequency with which certain scores occur.

E N D
Frequency Distribution Table (grouped) start What it is Why and how to Group Terminology How to create one
What it is A Frequency Distribution table will show the frequency with which certain scores occur. For example, we might want to know the number of marks scored in an exam by the students of a class,
What it is A Frequency Distribution table will show the frequency with which certain scores occur. Or… … the ages of students in that class.
Why group Sometimes the data we are considering has such a large range of scores that it is necessary to collect the scores into groups or classes to make them easier to understand. The example above shows the number of marks scored in an exam. To see guidelines for grouping click here Next slide
How to group Groups are decided on by looking at the range of the scores and choosing the interval so that there are about 5 to 15 groups. In this example the exam marks are grouped in tens. To see guidelines for grouping click here
Terminology In this section you will read the term array, for the purpose of this lesson an array is a group of cells. There is reference to three types of array: dataarray,binsarray andreturnarray.
Data Array A Data Array is a set of values This Data Array refers to the marks gained by a group of students in an exam. Terminology
Bins Array A Bins Array shows the ranges into which you want to group the values in the Data Array and the upper limit of each group. It is the values in the Upper Limit column which will be used in the frequency formula. Next slide
Organising data in bins 80 93 63 74 51 60 61 53 69 54 50 43 32 70 40 30 55 57 59 55 4 50 42 47 53 52 67 44 35 48 37 56 39 52 12 44 43 58 49 32 65 64 62 73 21 21 86 67 75 68 90-99 0-9 10-19 20-29 30-39 40-49 50-59 60-69 70-79 80-89 Terminology
Return Array A Return Array shows the result of the frequency distribution formula. The frequency is the number of marks included in each group. The figures in the Frequency column are called the Return Array Terminology
Access data Establish the lowest and highest scores Group data Key in upper limit of groupings Enter frequency array formula Example of Completed Table How To Create A Frequency Distribution Table
Access Data The figures below show the list of exam marks of students studying Spreadsheets Key in, or import the data to be used. back
Establish the lowest and highest scores Here we have used the formulae =MIN and =MAX to find the lowest and highest scores To see the results click here back
Key in upper limit of groupings These are the highest numbers in each group. These will be used as the Bins Array in the frequency distribution formula. back
Enter frequency array formula Highlight not just one cell but all the cells which will contain the frequencies. In this example the cells C13 to C22 have been highlighted. next
Enter frequency array formula Type: =FREQUENCY(data array,bins array). Press CTRL+SHIFT+ENTER The formula will go into all of the cells. next
Enter frequency array formula This is the result of the formula, the Return Array. back
Press Esc to exit Completed Table Data Array Lowest and highest scores Groups and Bins Array Return Array Back to main menu