Download
1 / 22
220 likes | 338 Views
Design elements of graphical representations. Term 2, 2011 Week 5. CONTENTS. Design elements of graphical representations Proportion Orientation Clarity & consistency Colour Contrast Usability Accessibility Appropriateness & relevance Design tools Layout diagrams

E N D
Design elements of graphical representations Term 2, 2011 Week 5
CONTENTS • Design elements of graphical representations • Proportion • Orientation • Clarity & consistency • Colour • Contrast • Usability • Accessibility • Appropriateness & relevance • Design tools • Layout diagrams • Other considerations • Questions
Design elements of graphical representations • Design elements are factors that enhance the appearance & functionality of solutions. • Graphic representations that are displayed on screen & form part of a solution need to be understood easily and accessed with minimum time & effort.
When designing an on-screen graphic, we must be careful to take into account the following design principles:
Proportion • Refers to the visual hierarchy of objects within the graphic representation. • What does this mean? • That the most important pieces of information have visual prominence in the graphic. • Titles, Axis Labels • The relative sizings & positioning of objects also affect the visual hierarchy of the graphic representation.
Orientation • Orientation refers to the direction & aspect of elements within a graphic. • When deciding on the orientation of objects, the designer should typically consider the direction of data labels, alignment of data labels & text, and whether the title will appear above or below the graphic.
Clarity & consistency • Clarity refers to how clearly the information in the graphic is presented & how well a user can differentiate between objects in the graphic form. • Consistency refers to the use of similar, recurring or conventional features, especially in regards to font styles & sizes of similar elements, as well as colour.
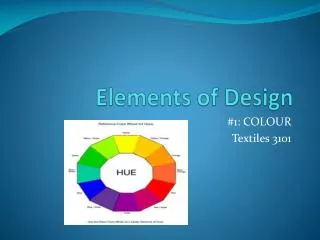
Colour • Colour should be used so that it makes the information clear, readable & attractive. • Conventions in regards to colour can be found on page 27 of your text book.
Contrast • Contrast refers to the visual difference in colours or tones between objects in graphic representations. • Greater contrast will make objects appear to stand out more from one another. If there is not enough contrast, it will appear that the objects blend in with one another. • The use of white space can enhance the contrast around objects within a given graphic representation.
Usability • All solutions need to be user friendly. When assessing a solution for usability, you should consider the following: - Can the user • understand the graphic form & the information it conveys? • quickly identify the purpose of the graphic & interpret its critical data? - Is the graphic form • accurate & a true reflection of the numerical data that has been analysed? • attractive & pleasing to the eye?
Accessibility • Users should be able to easily gain meaning & relevant information from graphic representations, in an efficient manner. • Users shouldn’t have to puzzle over the meaning of any text or symbols used, as such, simple & relevant labels and commonly understood symbols should be utilised.
Appropriateness & relevance • A solution must meet the needs of the intended audience with appropriate information that is relevant. • Extra information or detail that doesn’t relate to the purpose of the solution should be avoided.
Design tools • Design tools are used to represent the functionality & appearance of a solution. • Usually, it is sketched on paper or created on a computer first. • The main advantage of designing a solution on paper first, is that it enables changes to be made easily without impacting on the development of the solution.
Layout diagrams • Layout diagrams provide a visual representation of how a final spread sheet or other information solution may look. • Layout Diagrams should clearly indicate: • Various data types to be entered • Is it an integer? Floating Point Number? Character? String? • Cell Contents • Labels (to assist with data entry into correct cells) • Functions to be used (ie. Mathematical calculations) • Validation rules, with possible error messages • Cell protection to be used, if any • Formats & Conventions to be used when manipulating spread sheet data
Layout diagrams should clearly indicate: • The shape of graphic representations • Chart titles, axis labels & legend • Formats & Conventions that are used in graphic representations • Any sorting to be applied to the data
Other considerations... • The data set that will be used as the basis of the graphic representation should also be considered. • The types and amount of data, as well as the purpose for developing a graphic representation are also factors in deciding the type of graphic representation to be used.
Questions • What are design elements? • Make a table that lists and describes the design elements. • Have a look at the line graph which shows unemployment figures (figure 1-25). Discuss how the elements have been used, and how successfully this has been done. • What is the purpose of using a design tool? • Use a layout diagram to sketch a more effective graphic representation of the data shown in Figure 1-24.