Download
1 / 32
340 likes | 527 Views
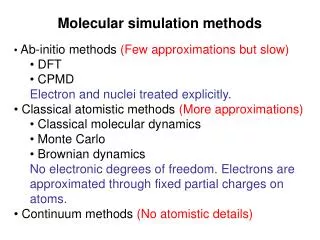
Introduction to molecular dating methods. 70. 80. 90. 50. 60. 30. 20. 10. 40. Principles. Ultrametricity: All descendants of any node are equidistant from that node For extant species, branches, in units of time, are ultrametric. A. B. C. D. E. F. 100.

E N D
70 80 90 50 60 30 20 10 40 Principles • Ultrametricity: All descendants of any node are equidistant from that node • For extant species, branches, in units of time, are ultrametric A B C D E F 100
Evolutionary branch length • Expected number of substitutions/site = rate of change x branch duration • Rate = 0.001 sub/site/Ma • “True” length = 0.02 • Actual length ≈ 0.02 20 Ma
What is a “molecular clock”? • All internodes have equal duration • All branches have equal rate of substitution • All tips are the same number of time units from the root • The expected number of substitutions per site is the same for all branches • The observed number of substitutions is the same for all descendants of a given node
A B The molecular clock idea • First proposed by Zuckerkandl and Pauling (1965) based on haemoglobin data • If there is the same rate for all branches there will be a linear relationship between sequence distance and time since divergence O
y If you know one divergence date then you can calculate others Percent sequence divergence x Time since divergence
If you know one divergence date then you can calculate others Percent sequence divergence x z Time since divergence
Stochastic rate variation Uncertainty in dating Range Issue 1: There will be error around the estimates Percent sequence divergence x z Time since divergence Inferred age
Actual relationship Actual age Issue 2: You need to correct for multiple hits Assumed relationship Percent sequence divergence x z Inferred age
Local clock: clade-specific rates Issue 3: Is evolution clock-like?
No clock: rates vary greatly Issue 3: Is evolution clock-like?
Why should we expect a clock? • Under neutral evolution: but that is too fast for most (all?) data sets • If there is reasonable constancy of population size, mutation rate, and patterns of selection • We can hope that rates of evolution change slowly and/or rarely
The likelihood approach • Consider two models of evolution • The usual model • The same model but • A root is specified • The summed branch lengths from any node to all descendants of that node are the same • Do a likelihood ratio test Which is the simpler model?
How many degrees of freedom? • Depends on the number of taxa (n) • Branch length parameters in the non-clock model = 2n - 3 • Branch length parameters in the clock model = n - 1 • Difference = (2n - 3) - (n - 1) = n - 2
22.5 If a clock model is not rejected • Calculate rates and then extrapolate from known to unknown pairwise distances DOA = 0.4 ; DAB = 0.1 TOA = 90 ; TAB = (0.1/0.4) x 90 = 22.5 Ma O A B 0.05 0.05 0.2 0.195 90
Should obtain confidence intervals around date estimates • Look at the curvature of the likelihood surface (can be done with PAML) • Use bootstrapping (parametric or non-parametric) • Generate multiple pseudoreplicate data sets • For each data set calculate relative nodal ages • Discard the upper and lower 2.5%
Calibrating the tree • How does one attach a date to an internal node? How old is the fossil? Where does a fossil fit on the tree?
F (90 Ma) Calibrating the tree • How does one attach a date to an internal node? How old is the fossil? Where does a fossil fit on the tree?
A B What does that tell us? F (90 Ma) O This node is at least 90 Ma
A B What else? This node is more than 90 Ma F O This node is at least 90 Ma
A B The lineage leading to F could have been missed F O This node is at least 90 Ma
General issues • Fossils generally provide only minimal ages • The age is attached to the node below the lowest place on the tree that the fossil could attach • Maximal or absolute ages can only be asserted when there are lots of fossil data • Geological events can sometimes be used to obtain minimal ages
What if a clock is rejected? • Until recently three (bad) choices • Give-up on molecular dating • Go ahead and use molecular dating anyway • Delete extra-fast or extra-slow taxa • Now we have other options • Assume local clocks • Relaxed clock methods
Can use likelihood ratio tests to compare to strict clock and non-clock modelsHow many parameters? Local clocks
Non-Parametric Rate-Smoothing(NPRS: Sanderson 1998) Node k d1 a d2 ^ The rate of branch a = ra= La/Ta (L = branch length; T = time duration)
Non-Parametric Rate-Smoothing(NPRS: Sanderson 1998) Node k d1 a d2 ^ ^ ^ ^ Measure of rate roughness = Rk = (ra -rd1)2 + (ra -rd2) 2
Non-Parametric Rate-Smoothing(NPRS: Sanderson 1998) d1 a d2 Adjust times so as to minimize overall roughness:
NPRS • Uses branch lengths only (ignores raw data) • Quick and easy to do • Assumes rate change is smooth
Penalized Likelihood(Sanderson 2001) • Semi-parametric likelihood approach • Uses raw data but penalizes the likelihood score by the roughness score, , weighted by a smoothness parameter () • Selects optimal value of using cross-validation (pick the value that minimizes the errors made in predicting branch lengths)
Penalized Likelihood • Uses more data than NPRS - more accurate • More difficult to implement