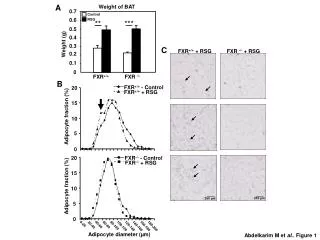
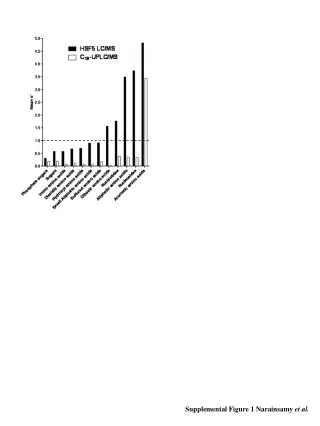
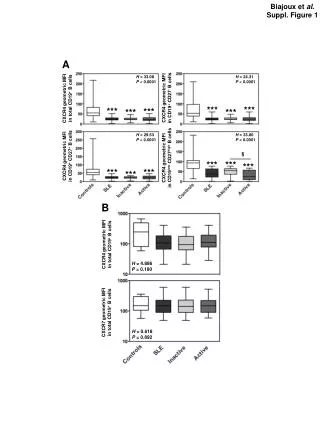
Download
1 / 2
20 likes | 152 Views
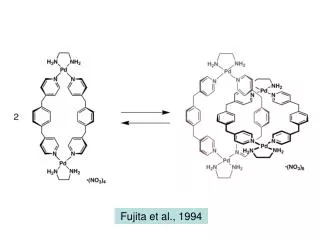
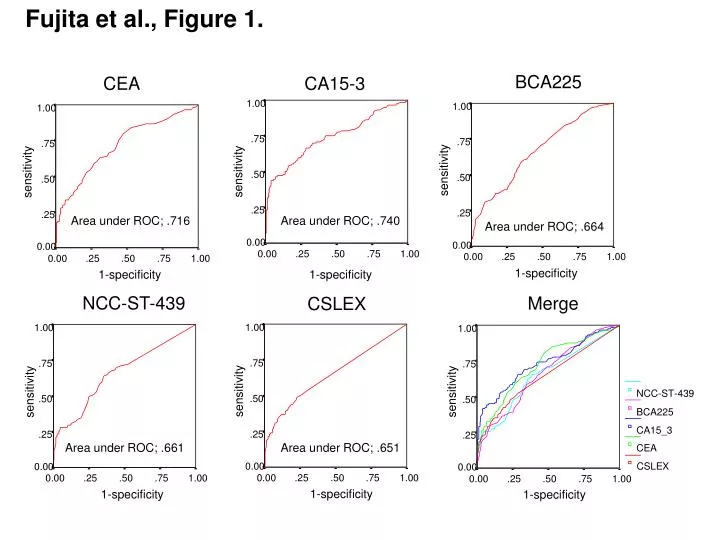
Fujita et al., Figure 1. CSLEX. NCC-ST-439. CEA. BCA225. 1.00. 1.00. 1.00. 1.00. CA15-3. 1.00. .75. Merge. .75. .75. .75. .75. sensitivity. 1.00. .50. sensitivity. sensitivity. sensitivity. .50. .50. .50. sensitivity. .50. .75. .25. .25. .25. .25. .25.

E N D
Fujita et al., Figure1. CSLEX NCC-ST-439 CEA BCA225 1.00 1.00 1.00 1.00 CA15-3 1.00 .75 Merge .75 .75 .75 .75 sensitivity 1.00 .50 sensitivity sensitivity sensitivity .50 .50 .50 sensitivity .50 .75 .25 .25 .25 .25 .25 Area under ROC; .716 Area under ROC; .740 sensitivity Area under ROC; .664 NCC-ST-439 0.00 .50 0.00 0.00 0.00 0.00 0.00 .25 .50 .75 1.00 BCA225 0.00 .25 .50 .75 1.00 0.00 0.00 .25 .25 .50 .50 .75 .75 1.00 1.00 0.00 .25 .50 .75 1.00 1-specificity CA15_3 1-specificity 1-specificity 1-specificity 1-specificity .25 CEA CSLEX 0.00 0.00 .25 .50 .75 1.00 1-specificity Area under ROC; .661 Area under ROC; .651
200 Fujita et al., Figure 2. 160 120 80 40 NCC-ST439 CSLEX 20 15 10 5 0 1 2 3 4 5 6 7 8 9 10 11 12 13 14 15 16 17 18 19 20 21 22 23 24 25 26 cut-off index (COI) case