Download

1 / 19
190 likes | 339 Views
Survey of New Zealand truck driver fatigue and fitness for duty. Professor: Liu Student: Ruby. 一、 Motive & Purpose. Motive - It has been doubt that fatigue is a main factor to the truck accident in New Zealand. Purpose- The authors was appointed by the Road

E N D
Survey of New Zealand truck driver fatigue and fitness for duty Professor: Liu Student: Ruby
一、Motive & Purpose Motive - It has been doubt that fatigue is a main factor to the truck accident in New Zealand. Purpose- The authors was appointed by the Road Safety Turst to make sure that the incidence of fatigue between truck driver.
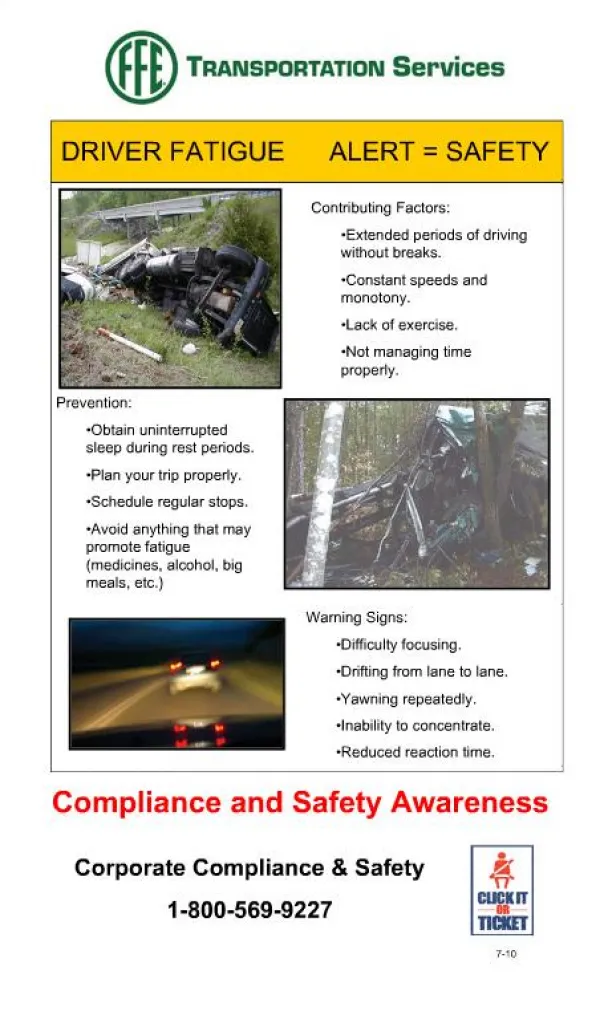
二、solving the problem • New Zealand is concerned about the fatigue between the driver. Therefore the authors want to avoid the car accident when the drivers feel fatigue and work.
三、References 1.Fatigue is a clear factor in crashes with 5.1% of the people death and 5.5% of the people get hurt. (LTSA,1999)
四、Methodology-Fatigue Measure • Two kinds of fatigue measures(600drivers) 1.a short survey asking drivers. 2.a short drive on a driving simulator.
四、Methodology-Equipment 1.A caravan. (place at truck depots, rest stop and cargo terminals) 2.The truck operator proficiency system (TOPS). a. keep the same speed and steering in a controlled. b. the nature phenomenon which is the random wind require steering correction. c. the side-task requiring and responses.
四、Methodology-TOPS’ scenario • The 8 minutes testing on a straight road. • 27-30 divided attention events show up. • Two minutes as one block and the first one block is the “warm up” which is not include in the analysis.
四、Methodology-the Experiment Design 3.1Calculate a pass/fail score in the five performance index. (依變數) 1.Curvature error variability 2.Divided attention response time variability 3.Throttle activity variability 4.Steering activity variability 5.Longitudinal speed variability
五、Result and Discussion • The data from the survey point that: 1.Age 2.The year of drive truck 3.Employment status 4.The type of the stuff being carring 5.The number on their truck’s axles 6.The drivers’ working hour 7.The average distances driven in each day
五、Result and Discussion • The three questions: 1.Do you think the fatigue is a problem to other drivers?(21% are always and often) 2.Do you think the fatigue is a problem for yourself?(8% are always and often) 3.Do you think the fatigue is never a problem for yourself?(13%) As we can see that fatigue is a dangerous factor for the drivers on the road.
五、Result and Discussion • The activity survey: 1.There have 33% of drivers said that they drive more than 11h in 24h 2.Control the eating habits of the drivers and an average of 1.5meal per day. (0.5 meal just like a light snack.)
五、Result and Discussion • The eight items comprising the Eqworth Sleepiness Survey. • Each question is assigned the score from 0-3 and then summed the total for the each driver. • The average is 7.53 and the S.D. is 4.47.
六、Result and Discussion • The performance of the simulator.(100 drivers) *91 passed all five performances. 9% failed the test. 1.Curvature error variability-8 peo. fail 2.Divided attention response time variability-2 peo. fail 3.Throttle activity variability-0 peo. fail 4.Steering activity variability-1 peo. fail 5.Longitudinal speed variability-2 peo. fail
五、Result and Discussion • Combining the interview data and the performance test, get an result- If the driver’s average daily route is fewer than 250km and age is more than 37 (mean age is 36) than it is more likely to fail the performance test. • There have a clearly different between older drivers and young drivers. Especially in the vehicle heading error, speed and accuracy of their RT in the divided attention task.
六、Conclusion • There are few problems brought up by the drivers. 1.Too much paperwork 2.Yard logistics 3.Trouble on the road 4.Follow the management
六、Conclusion • There have some factors influenced the safety and the driver ability when they have task, such as: 1.Operational 2.Social 3.Vehicle 4.Roading basic structure 5.Fatigue related to a lake of sleep
七、Effective Change Now, New Zealand uses an effective method to improve the question. If the transport operators are not qualified and give them the assistance. Therefore, if they still failing test, they must be removal the operator from the industry.