Download
1 / 28

E N D
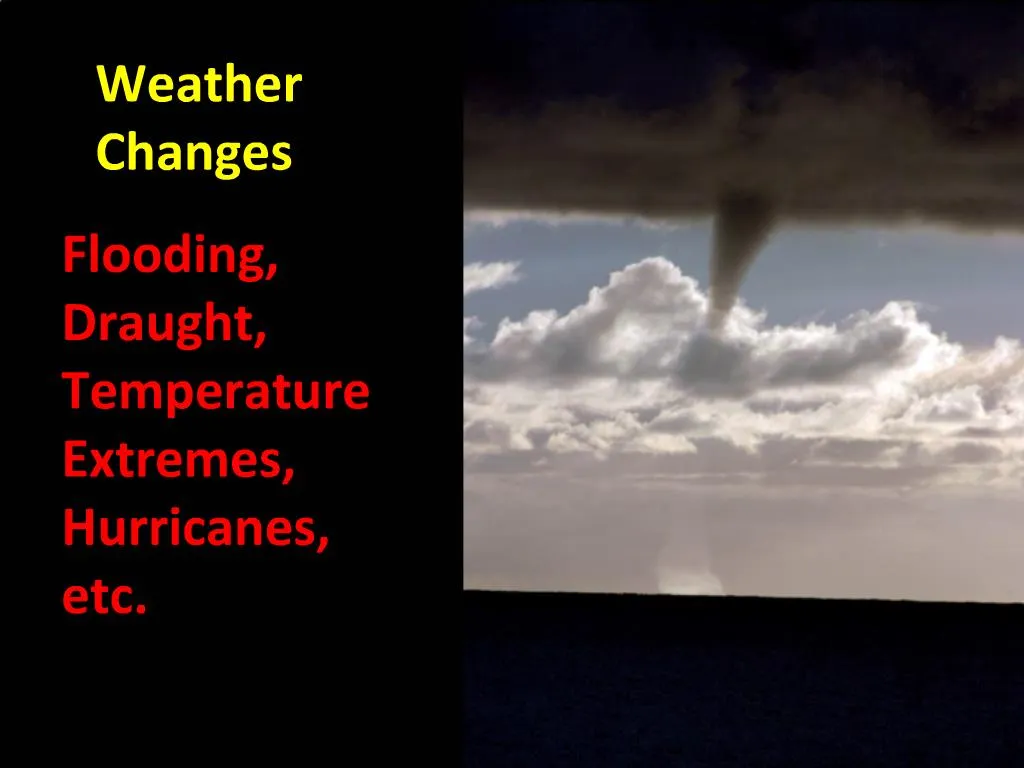
1. Weather Changes Flooding, Draught, Temperature Extremes, Hurricanes, etc.
2. Change in Precipitation Computer simulation of the future annual mean precipitation from 2080 to 2090. The yellow and red areas are regions of decreased precipitation that are drought-prone, and the light and dark blue regions of excess precipitation are prone to flooding or heavy snow. Although this is a computer projection for about 80 years in the future, the drought and increased rain areas are occurring in these regions today. This suggests that the simulations may be underestimating the rate of change. From UN IPCC 4thAssessment 2007. Computer simulation of the future annual mean precipitation from 2080 to 2090. The yellow and red areas are regions of decreased precipitation that are drought-prone, and the light and dark blue regions of excess precipitation are prone to flooding or heavy snow. Although this is a computer projection for about 80 years in the future, the drought and increased rain areas are occurring in these regions today. This suggests that the simulations may be underestimating the rate of change. From UN IPCC 4thAssessment 2007.
3. Growth in number of people affected by weather disasters This shows the rise in the number of people affected by extreme weather from 1980 to 2007. This shows the rise in the number of people affected by extreme weather from 1980 to 2007.
4. Heavy Rain and Flooding
5. Increase in Heavy Rain Events An increasing area of the US is experiencing very heavy daily precipitation events. Annual values of the percentage of the United States with a much greater than normal proportion
of precipitation due to very heavy (equivalent to the highest tenth percentile) 1-day precipitation amounts. From Gleason et al. (2008) updated by NOAA at /www.ncdc.noaa.gov/oa/
climate/research/cei/cei.html.An increasing area of the US is experiencing very heavy daily precipitation events. Annual values of the percentage of the United States with a much greater than normal proportion
of precipitation due to very heavy (equivalent to the highest tenth percentile) 1-day precipitation amounts. From Gleason et al. (2008) updated by NOAA at /www.ncdc.noaa.gov/oa/
climate/research/cei/cei.html.
6. Number of Floods by Continent and Decade From 1950 to 2000 The number of weather-related disasters has quadrupled over the past 20 years and the world should do more to prepare for them, the aid agency Oxfam says.
Population increases mean more people are affected when catastrophic weather events take place, it says in a report. Global warming is to blame for the growing number of weather disasters, Oxfam adds. An average of 500 such disasters are now taking place each year, compared to 120 in the 1980s, the report says. The number of floods has increased six-fold over the same period.The number of weather-related disasters has quadrupled over the past 20 years and the world should do more to prepare for them, the aid agency Oxfam says.
Population increases mean more people are affected when catastrophic weather events take place, it says in a report. Global warming is to blame for the growing number of weather disasters, Oxfam adds. An average of 500 such disasters are now taking place each year, compared to 120 in the 1980s, the report says. The number of floods has increased six-fold over the same period.
7. Global Increase in Heavy Precipitation 1900-2100 Simulated and projected changes in the amount of precipitation falling in the heaviest 5% of daily events. The shaded areas show the likely ranges while the lines show the central projections from a set of climate models. Changes are relative to the 1960-1979 average.Simulated and projected changes in the amount of precipitation falling in the heaviest 5% of daily events. The shaded areas show the likely ranges while the lines show the central projections from a set of climate models. Changes are relative to the 1960-1979 average.
8. Cedar Rapids, Iowa During the Flood of June, 12, 2008