Download
1 / 40
400 likes | 617 Views
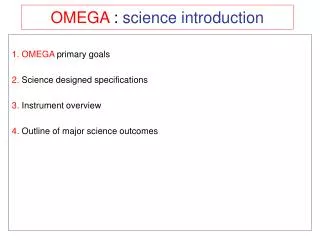
OMEGA : science introduction. 1. OMEGA primary goals 2. Science designed specifications 3. Instrument overview 4. Outline of major science outcomes. OMEGA. O bservatoire, pour la M inéralogie, l’ E au, les G laces, et l’ A ctivité. Observatory Mineralogy Water Ices

E N D
OMEGA : science introduction 1. OMEGA primary goals 2. Science designed specifications 3. Instrument overview 4. Outline of major science outcomes
OMEGA O bservatoire, pour la M inéralogie, l’ E au, les G laces, et l’ A ctivité Observatory Mineralogy Water Ices Activity P.I.: J-P. Bibring, Institut d’Astrophysique Spatiale d’Orsay 40 coI’s, including Ray Arvidson, which is hosting us today at WU
OMEGA : science introduction OMEGA was selected in 1988, to fly onboard the Mars 96 Russian mission. Its design was made soon after, to achieve the goals conceived as prime at that time, with the available flight qualified technology. At this time, almost no surface compositional data were available, except from those derived from the two Viking Lander APXS sets of measurements : our understanding of Mars state, history and evolution was essentially based on optical imaging. The goal for a large community was thus to produce compositional data to be coupled with imaging data already acquired or to be acquired (inferring the geomorphological context). Together with US colleagues (VIMS/Mars Observer) we considered that NIR spectral imaging was the right answer to achieve the above quoted goal. For planetary objects of temperature ~ 300K, NIR is the domain of reflectance spectroscopy (crossover to thermal emission: 3 to 4 µm).
OMEGA :science introduction OMEGA was decided at the time ISM / Phobos was launched, in 1988. ISM constituted the first ever designed and flown NIR spectral imager. For transfer of technology constraints, it was highly limited technically. However, it demonstrated the potential of NIR reflectance spectrometry to derive atmospheric and surface composition, and the benefit of coupling imaging and spectrometry to acquire the composition of each resolved pixel. Consequently, OMEGA specifications were derived for: imaging: space sampling (IFOV) and FOV spectrometry: spectral sampling and spectral range radiometry: SNR
OMEGA :science introduction imaging: ISM demonstrated that surface diversity exists at all observed space scales (down to a few km). Thus, the goal for OMEGA was to get as high as possible a sampling. Trade off is thus between sampling and coverage. Given the lack of Mars compositional knowledge at that time, we wanted to have the capability to acquire the global coverage of the surface. With the envisioned downlink profile and mission duration, km-scale coverage was a realistic goal. For a given orbit, this drives the IFOV, thus the surface sampling. We chose an IFOV of 1.2 mrad ( ~ 4.1 arcmin). The associated surface sampling depends on the altitude of observation (along the elliptical orbit): 300 m from 250 km 4.8 km from 4000 km
OMEGA :science introduction spectrometry: NIR reflectance spectrometry is the means to derive composition from specific quantum transition to excited states through (solar) photon absorption. Identification is made by comparison with library spectra (potential bias and limitation). 1. Spectral domain VIS + NIR corresponds to electronic states (marginally), and primarily to vibration modes (radical and molecules). Most non symmetrical species (permanent dipole) have diagnostic transitions in the NIR, which constitutes the reflectance domain (λmT = 2900 µm.K → reflectance/thermal crossover @ ~3 µm, thermal dominates above 5 µm). For OMEGA, we chose: 0.35 – 5.1 µm
OMEGA :science introduction 2. Spectral sampling 2.1. Atmospheric (gaseous) transitions lead to very narrow (rotational) lines (<< 1 nm width): FS is the means to achieve such a sampling over a wide spectral range. However, it requires moving parts, and is difficult to couple to imagery (in particular too large spectral sampling over a large spectral domain precludes large spatial sampling, for data volume constraint). Grating spectroscopy is easier to implement in an imaging mode. However, given the achievable resolution (typically λ/Δλ ~100 to 500), sampling of a ~10 nm is achievable. We chose for OMEGA: 7nm from 0.35 to 1 µm 13 nm from 1 to 2.5 µm 20 nm from 2.5 to 5.1 µm With such a reduced sampling, individual lines are summed, which reduces sensitivity, but enables (in a few cases) to unambiguously identify species: Martian CO2, CO, H2O and O2 can be identified along a nadir line, and even along limb sounding.
OMEGA :science introduction 2. Spectral sampling 2.2. Surface (solid) transitions lead to rather broad features, summing up a diversity of environments at a microscopic scale: 10 to 20 nm is adequate. Other solid compounds (aerosols, even clouds) do exhibit diagnostic signatures. The position of the maximum absorption is diagnostic of the bounding, while the shape gives potentially access to other parameters, such as : mean grain size, temperature etc…Most vibration transitions in this domain are not fundamental modes, but combination of harmonics: in a few cases, several transitions are present in the NIR domain. Species potentially identified range from surface minerals to frosts, to atmospheric aerosols and clouds.
OMEGA :science introduction 1. How to build a spectral image 2.How to identify species
VNIR SWIR
“Visible” channel pushbroom mode near IR channel whiskbroom mode
OMEGA"visible" channel One line of 128 pixels at the surface of Mars is imaged at once, and spectrally dispersed along the other dimension of the matrix.
spectral imagery in pushbroom mode imaged line
spectral imagery in pushbroom mode λ1 imaged line λ2 spectral dispersion λn
NIR channel: 1 telescope with a scanner 2 spectrometers 2 linear arrays of 128 elements ("spectels“), each cooled by a crycooler SWIR-C0.93 to 2.6 µm sampling: ~ 13 nm SWIR-L2.5 to 5.1 µm sampling: ~ 20 nm
OMEGA: whiskbroom mode λn λ λ1 scanner (cross-track) x image building
OMEGA: whiskbroom mode along the track (spacecraft drift) λn y λ λ1 image building
OMEGA: whiskbroom mode orbital drift scanning mirror
OMEGA: whiskbroom mode orbital drift scanning mirror
OMEGA: whiskbroom mode λn λ λ1 y x
OMEGA: 3D hyperspectral images λn λ λ1 y x
mafic silicates Forsterite Fayalite olivine Diopside Enstatite I/F (offset for clarity) pyroxene Wavelength (µm)
Pyroxenes (HCP) pristine unaltered ancient crust
The ancient crust has still its pristine composition, with a mixture of LCP and HCP, while the lava outflows are enriched in HCP (partial melt). Olivine-rich spots are also identified. olivine: red LCP: green HCP: blue Nili Fossae / Nili Patera
water alteration products: carbonates Siderite Hydromagnesite Dolomite Calcite Aragonite I/F (offset for clarity) Wavelength (µm)
water alteration products: sulfates Natrojarosite Epsomite Kieserite Jarosite Gypsum I/F (offset for clarity) Wavelength (µm)
water alteration products: phyllosilicates Smectite Serpentine Saponite Nontronite Montmorillonite Kaolinite I/F (offset for clarity) OH M- OH Wavelength (µm)
1.4 µm 1.9 µm 2.20 µm OMEGA spectral ratio laboratory spectrum OMEGA Al-rich phyllosilicate Mawrth Vallis (20.60° W, 25.53° E)
2.28 µm OMEGA spectra ratio laboratory spectrum OMEGA Fe-rich phyllosilicate Nili Syrtis Mensa (73.32° E, 29.30° N)
2.35 µm OMEGA spectra ratio laboratory spectrum OMEGA Mg/Fe-rich phyllosilicate Syrtis Major (71.73° E, 17.09° N)
1.9 µm hydration band intensity olivine: red LCP: green HCP: blue Nili Fossae / Nili Patera
Water alteration products are in the oldest terrains
H2O and CO2 frosts and ices • perennial and seasonal caps are critical players • for the present and past climate of the planet • perennial caps dominate the inventory of Martian H2O today
evolution of the southern seasonal cap during retreat from Ls 220° to Ls 250° (mid spring) Left: albedo in the continuum Center: CO2 ice signature Right: H2O ice signature
OMEGA : summary On each pixel, OMEGA has the potential to identify: atmospheric constituents: CO2, CO, H2O, O2/O3, clouds, aerosols short timescales evolution (days to months) surface frosts: CO2, H2O short timescales evolution (months to years) surface ices: CO2, H2O medium timescales evolution (10’s to 104’s years) surface minerals long timescales evolution (107’s to 109’s years)