Download
1 / 48
480 likes | 667 Views
Gene Expression BMI 731 week 5. Catalin Barbacioru Department of Biomedical Informatics Ohio State University. Thesis: the analysis of gene expression data is going to be big in 21st century statistics. Many different technologies, including High-density nylon membrane arrays

E N D
Gene ExpressionBMI 731 week 5 Catalin Barbacioru Department of Biomedical Informatics Ohio State University
Thesis: the analysis of gene expression data is going to be big in 21st century statistics Many different technologies, including High-density nylon membrane arrays Serial analysis of gene expression (SAGE) Short oligonucleotide arrays (Affymetrix) Long oligo arrays (Agilent) Fibre optic arrays (Illumina) cDNA arrays (Brown/Botstein)*
600 500 400 300 Number of papers 200 100 0 1995 1996 1997 1998 1999 2000 2001 (projected) Year Total microarray articles indexed in Medline
Common themes • Parallel approach to collection of very large amounts of data (by biological standards) • Sophisticated instrumentation, requires some understanding • Systematic features of the data are at least as important as the random ones • Often more like industrial process than single investigator lab research • Integration of many data types: clinical, genetic, molecular…..databases
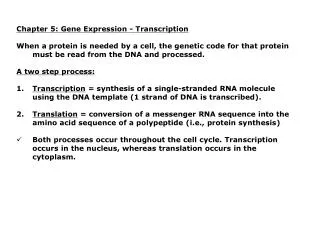
Transcription RNA polymerase G U A A U C C mRNA Biological background DNA G T A A T C C T C | | | | | | | | | C A T T A G G A G
Idea: measure the amount of mRNA to see which genes are being expressedin (used by) the cell. Measuring protein might be better, but is currently harder.
Reverse transcription Clone cDNA strands, complementary to the mRNA G U A A U C C U C mRNA Reverse transcriptase T T A G G A G cDNA C A T T A G G A G C A T T A G G A G C A T T A G G A G C A T T A G G A G C A T T A G G A G C A T T A G G A G C A T T A G G A G C A T T A G G A G C A T T A G G A G
cDNA microarray experiments mRNA levels compared in many different contexts Different tissues, same organism (brain v. liver) Same tissue, same organism (ttt v. ctl, tumor v. non-tumor) Same tissue, different organisms (wt v. ko, tg, or mutant) Time course experiments (effect of ttt, development) Other special designs (e.g. to detect spatial patterns).
DNA microarrays represent an important new method for determining the complete expression profile of a cell. • Monitoring gene expression lies at the heart of a wide variety of medical and biological research projects, including classifying diseases, understanding basic biological processes, and identifying new drug targets.
Affymetrix® Instrument System Platform for GeneChip® Probe Arrays • Integrated • Exportable • Easy to use • Versatile
Light (deprotection) Mask TTOOO OOOOO HO HO OOO T – Substrate Light (deprotection) Mask CATAT AGCTG TTCCG TTCCO TTOOO C – Substrate REPEAT Synthesis of Ordered Oligonucleotide Arrays
* * * * * GeneChip® Probe Arrays Hybridized Probe Cell GeneChipProbe Array Single stranded, labeled RNA target Oligonucleotide probe 24µm Millions of copies of a specific oligonucleotide probe 1.28cm >200,000 different complementary probes Image of Hybridized Probe Array
Analysis of expression level from probe sets A single, contiguous gene set for the rat B-actin gene. Each pixel is quantitated and integrated for each oligo feature (range 0-25,000) Perfect Match (PM) Mis Match (MM) Control log(PM / MM) = difference score All significant difference scores are averaged to create “average difference” = expression level of the gene.
Expression screening by GeneChip • each oligo sequence (20-25 mer) is synthesized as a 20 µ square (feature) • each feature contains > 1 million copies of the oligo • scanner resolution is about 2 µ (pixel) • each gene is quantitated by 16-20 oligos and compared to equal # of mismatched controls • 22,000 genes are evaluated with 20 matching oligos and 10 mismatched oligos = 480,000 features/chip • 480,000 features are photolithographically synthesized onto a 2 x 2 cm glass substrate
Affymetrix GeneChip arrays • Global views of gene expression are often essential for obtaining comprehensive pictures of cell function. • For example, it is estimated that between 0.2 to 10% of the 10,000 to 20,000 mRNA species in a typical mammalian cell are differentially expressed between cancer and normal tissues. • Whole-genome analyses also benefit studies where the end goal is to focus on small numbers of genes, by providing an efficient tool to sort through the activities of thousands of genes, and to recognize the key players. • In addition, monitoring multiple genes in parallel allows the identification of robust classifiers, called "signatures", of disease. • Global analyses frequently provide insights into multiple facets of a project. A study designed to identify new disease classes, for example, may also reveal clues about the basic biology of disorders, and may suggest novel drug targets.
cDNA microarrays • In ‘‘spotted’’ microarrays, slides carrying spots of target DNA are hybridized to fluorescently labeled cDNA from experimental and control cells and the arrays are imaged at two or more wavelengths • Expression profiling involves the hybridization of fluorescently labeled cDNA, prepared from cellular mRNA, to microarrays carrying thousands of unique sequences. • Typically, a set of target DNA samples representing different genes is prepared by PCR and transferred to a coated slide to form a 2-D array of spots with a center-to-center distance (pitch) of about 200 μm, providing a pan-genomic profile in an area of 3 cm2 or less. • cDNA samples from experimental and control cells are labeled with different color fluors (cytochrome Cy5 and Cy3) and hybridized simultaneously to microarrays, and the relative levels of mRNA for each gene are then determined by comparing red and green signal intensities
cDNA microarrays Scanning Technology • Microarray slides are imaged with a modified fluorescence microscope designed for scanning large areas at high resolution (arrayWoRx, Applied Precision, Issaquah, WA, Affymetrix). • Fluorescence illumination are obtained from a metal halide arc lamp focused onto a fiber optic bundle, the output of which is directed at the microarray slide and emission recorded through a microscope objective (Nikon) onto a cooled CCD (charge-coupled device) camera. • Interference filters are used to select the excitation and emission wavelengths corresponding to the Cy3 and Cy5 fluorescent probes (Amersham Pharmacia). • Each image covered a 2.4 x 2.4 mm area of the slide at 5-μm resolution. To scan the entire microarray, a series of images (‘‘panels’’) were acquired by moving the slide under the microscope objective in 2.4-mm increments.
Biological question Differentially expressed genes Sample class prediction etc. Experimental design Microarray experiment 16-bit TIFF files Image analysis (Rfg, Rbg), (Gfg, Gbg) Normalization R, G Estimation Testing Clustering Discrimination Biological verification and interpretation
Some statistical questions Image analysis: addressing, segmenting, quantifying Normalisation: within and between slides Quality: of images, of spots, of (log) ratios Which genes are (relatively) up/down regulated? Assigning p-values to tests/confidence to results.
Some statistical questions, ctd Planning of experiments: design, sample size Discrimination and allocation of samples Clustering, classification: of samples, of genes Selection of genes relevant to any given analysis Analysis of time course, factorial and other special experiments…..…...& much more.
Some bioinformatic questions Connecting spots to databases, e.g. to sequence, structure, and pathway databases Discovering short sequences regulating sets of genes: direct and inverse methods Relating expression profiles to structure and function, e.g. protein localisation Identifying novel biochemical or signalling pathways, ………..and much more.
Part of the image of one channel false-coloured on a white (v. high) red (high) through yellow and green (medium) to blue (low) and black scale
Segmentation: limitation of the fixed circle method Fixed Circle SRG Inside the boundary is spot (foreground), outside is not.
Some local backgrounds Single channel grey scale We use something different again: a smaller, less variable value.
Quantification of expression For each spot on the slide we calculate Red intensity (PM) = Rfg - Rbg fg = foreground, bg = background, and Green intensity (MM) = Gfg - Gbg and combine them in the log (base 2) ratio Log2(Red intensity / Green intensity) Log2(PM / MM)
Gene Expression Data On p genes for nslides:p is O(10,000), n is O(10-100), but growing, Slides slide 1 slide 2 slide 3 slide 4 slide 5 … 1 0.46 0.30 0.80 1.51 0.90 ... 2 -0.10 0.49 0.24 0.06 0.46 ... 3 0.15 0.74 0.04 0.10 0.20 ... 4 -0.45 -1.03 -0.79 -0.56 -0.32 ... 5 -0.06 1.06 1.35 1.09 -1.09 ... Genes Gene expression level of gene 5 in slide 4 = Log2(Red intensity / Green intensity) These values are conventionally displayed on a red(>0)yellow (0)green (<0) scale.
The red/green ratios can be spatially biased • . Top 2.5%of ratios red, bottom 2.5% of ratios green
Affymetrix vs. cDNA Arrays Affy Strengths: - highly reliable: synthesized in situ - highly reproducible from run to run - no clone maintenance or ‘drift’ - sealed fluidics and controlled temperature - standardized chips increase database power - excellent scanner - complex, but very reliable labelling - excellent cost/benefit ratio - amenable to mutation and SNP detection
Affymetrix weaknesses/limitations • not easily customized: $300K/chip • high labeling cost $170/chip • high per chip cost $350 to $1850 • limited choice of species • requires knowledge of sequence • not designed for competitive protocols
Limitations to all microarrays. • dynamic range of gene expression: • very difficult to simultaneously detect low and high • abundance genes accurately • - each gene has multiple splice variants • 2 splice variants may have opposite effects (i.e. trk) • arrays can be designed for splicing, but complexity ^ 5X • - translational efficiency is a regulated process: • mRNA level does not correlate with protein level • - proteins are modified post-translationally • glycosylation, phosphorylation, etc. • - pathogens might have little ‘genomic’ effect
Analysis • In general the expression level of individual genes is measured by log(PM/MM) or log(R/G). • Intensity-dependent normalization methods are preferred over a global methods. • To correct intensity- and dye-bias we used location and scale normalization methods, which are based on robust, locally linear fits (lowess). • Global methods use linear regression models, combined with ANOVA.
Normalization Why? To correct for systematic differences between samples on the same slide, or between slides, which do not represent true biological variation between samples. How do we know it is necessary? By examining self-self hybridizations, where no true differential expression is occurring. We find dye biases which vary with overall spot intensity, location on the array, plate origin, pins, scanning parameters,….
Analysis Post-normalization Pre-normalization
The simplest cDNA microarray data analysis problem is identifying differentially expressed genes using replicated slides There are a number of different aspects: • First, between-slide normalization; then • What should we look at: averages, SDs, t-statistics, other summaries? • How should we look at them? • Can we make valid probability statements?
Apo AI experiment (Matt Callow, LBNL) Goal. To identify genes with altered expression in the livers of Apo AI knock-out mice (T) compared to inbred C57Bl/6 control mice (C). • 8 treatment mice and 8 control mice • 16 hybridizations: liver mRNA from each of the 16 mice (Ti , Ci ) is labelled with Cy5, while pooled liver mRNA from the control mice (C*) is labelled with Cy3. • Probes: ~ 6,000 cDNAs (genes), including 200 related to lipid metabolism.
Which genes have changed?When permutation testing possible 1. For each gene and each hybridisation (8 ko + 8 ctl), use M=log2(R/G). 2. For each gene form the t statistic: average of 8 ko Ms - average of 8 ctl Ms sqrt(1/8 (SD of 8 ko Ms)2 + (SD of 8 ctl Ms)2) 3. Form a histogram of 6,000 t values. 4. Do a normal q-q plot; look for values “off the line”. 5. Permutation testing (next lecture). 6. Adjust for multiple testing (next lecture).
Patterns, More Globally... Can we identify genes with interesting patterns of expression across arrays? Two approaches: 1. Find the genes whose expression fits specific, predefined patterns. 2. Perform cluster analysis - see what expression patterns emerge.
The 16 groups systematically arranged (6 point representation)