Download
1 / 1

E N D
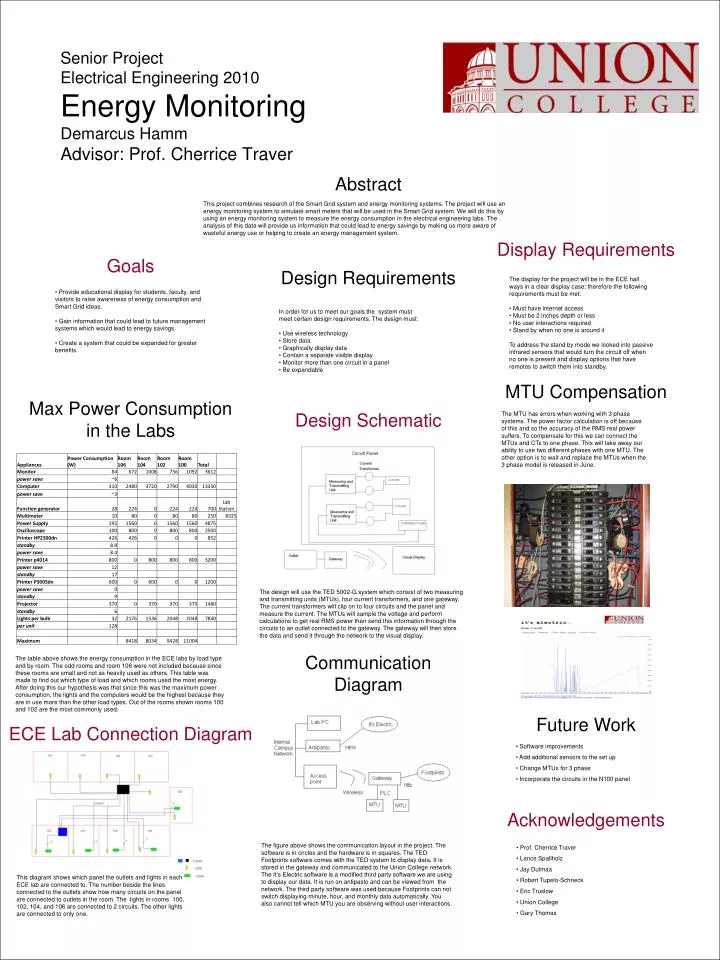
Abstract This project combines research of the Smart Grid system and energy monitoring systems. The project will use an energy monitoring system to simulate smart meters that will be used in the Smart Grid system. We will do this by using an energy monitoring system to measure the energy consumption in the electrical engineering labs. The analysis of this data will provide us information that could lead to energy savings by making us more aware of wasteful energy use or helping to create an energy management system. Display Requirements Goals Design Requirements • The display for the project will be in the ECE hall ways in a clear display case; therefore the following requirements must be met: • Must have internet access • Must be 2 inches depth or less • No user interactions required • Stand by when no one is around it • To address the stand by mode we looked into passive infrared sensors that would turn the circuit off when no one is present and display options that have remotes to switch them into standby. • Provide educational display for students, faculty, and visitors to raise awareness of energy consumption and Smart Grid ideas. • Gain information that could lead to future management systems which would lead to energy savings. • Create a system that could be expanded for greater benefits. Senior ProjectElectrical Engineering 2010Energy MonitoringDemarcus HammAdvisor: Prof. Cherrice Traver • In order for us to meet our goals the system must meet certain design requirements. The design must: • Use wireless technology • Store data • Graphically display data • Contain a separate visible display • Monitor more than one circuit in a panel • Be expandable MTU Compensation Max Power Consumption in the Labs Design Schematic The MTU has errors when working with 3 phase systems. The power factor calculation is off because of this and so the accuracy of the RMS real power suffers. To compensate for this we can connect the MTUs and CTs to one phase. This will take away our ability to use two different phases with one MTU. The other option is to wait and replace the MTUs when the 3 phase model is released in June. The design will use the TED 5002-G system which consist of two measuring and transmitting units (MTUs), four current transformers, and one gateway. The current transformers will clip on to four circuits and the panel and measure the current. The MTUs will sample the voltage and perform calculations to get real RMS power then send this information through the circuits to an outlet connected to the gateway. The gateway will then store the data and send it through the network to the visual display. Communication Diagram The table above shows the energy consumption in the ECE labs by load type and by room. The odd rooms and room 108 were not included because since these rooms are small and not as heavily used as others. This table was made to find out which type of load and which rooms used the most energy. After doing this our hypothesis was that since this was the maximum power consumption, the lights and the computers would be the highest because they are in use more than the other load types. Out of the rooms shown rooms 100 and 102 are the most commonly used. Future Work ECE Lab Connection Diagram • Software improvements • Add additional sensors to the set up • Change MTUs for 3 phase • Incorporate the circuits in the N100 panel Acknowledgements The figure above shows the communication layout in the project. The software is in circles and the hardware is in squares. The TED Footprints software comes with the TED system to display data. It is stored in the gateway and communicated to the Union College network. The It’s Electric software is a modified third party software we are using to display our data. It is run on antipasto and can be viewed from the network. The third party software was used because Footprints can not switch displaying minute, hour, and monthly data automatically. You also cannot tell which MTU you are observing without user interactions. • Prof. Cherrice Traver • Lance Spallholz • Jay Dulmaa • Robert Tupelo-Schneck • Eric Truslow • Union College • Gary Thomas This diagram shows which panel the outlets and lights in each ECE lab are connected to. The number beside the lines connected to the outlets show how many circuits on the panel are connected to outlets in the room. The lights in rooms 100, 102, 104, and 106 are connected to 2 circuits. The other lights are connected to only one.