Download
1 / 17
170 likes | 175 Views
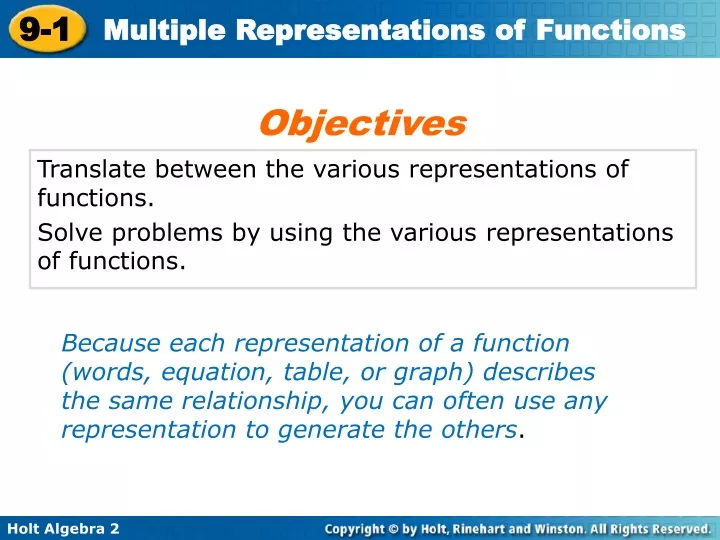
Objectives. Translate between the various representations of functions. Solve problems by using the various representations of functions.

E N D
Objectives Translate between the various representations of functions. Solve problems by using the various representations of functions. Because each representation of a function (words, equation, table, or graph) describes the same relationship, you can often use any representation to generate the others.
Notes: Recreation Application Janet is rowing across an 80-meter-wide river at a rate of 3 meters per second. A) Create a table B) Write an equation (linear, quadratic or exponential), C) Graph of the distance that Janet has remaining before she reaches the other side. D) When will Janet reach the shore?
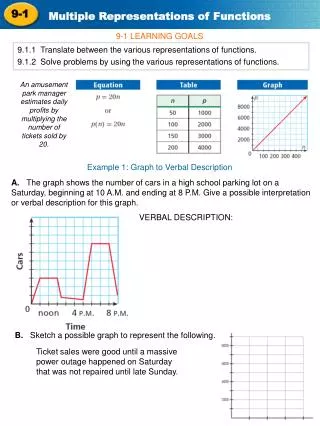
An amusement park manager estimates daily profits by multiplying the number of tickets sold by 20. This verbal description is useful, but other representations of the function may be more useful. These different representations can help the manager set, compare, and predict prices.
Example 1: Business Application Sketch a possible graph to represent the following. Ticket sales were good until a massive power outage happened on Saturday that was not repaired until late Sunday. The graph will show decreased sales until Sunday.
Example 2A What if …? Sketch a possible graph to represent the following. The weather was beautiful on Friday and Saturday, but it rained all day on Sunday and Monday. The graph will show decreased sales on Sunday and Monday.
Only of the rides were running on Friday and Sunday. Example 2B Sketch a possible graph to represent the following. The graph will show decreased sales on Friday and Sunday.
Example 3: Using Multiple Representations to Solve Problems A hotel manager knows that the number of rooms that guests will rent depends on the price. The hotel’s revenue depends on both the price and the number of rooms rented. The table shows the hotel’s average nightly revenue based on room price. Use a graph and an equation to find the price that the manager should charge in order to maximize his revenue.
Example 3A Continued Does the data does appear linear, quadratic or exponential?
Example 3B: Using Multiple Representations to Solve Problems An investor buys a property for $100,000. Experts expect the property to increase in value by about 6% per year. Use a table, a graph and an equation to predict the number of years it will take for the property to be worth more than $150,000.
Example 3B Continued Make a table for the property. Because you are interested in the value of the property, make a graph, by using years t as the independent variable and value as the dependent variable. Identify as linear, quadratic, or exponential.
Example 4 4A. The graph shows the number of cars in a high school parking lot on a Saturday, beginning at 10 A.M.and ending at 8 P.M.Give a possible interpretation for this graph. Possible answer: Football practice goes from 11:00 A.M. until 1:00 P.M. Families begin arriving at 4:00 P.M. for a play that begins at 5:00 P.M. and ends at 7:00 P.M. After the play, most people leave.
Notes: Recreation Application Janet is rowing across an 80-meter-wide river at a rate of 3 meters per second. A) Create a table B) Write an equation (linear, quadratic or exponential), C) Graph of the distance that Janet has remaining before she reaches the other side. D) When will Janet reach the shore?
Notes Step 1 Create a table. Let t be the time in seconds and d be Janet’s distance, in meters, from reaching the shore. Janet begins at a distance of 80 meters, and the distance decreases by 3 meters each second.
Distance is equal to minus 80 3 meters per second. Notes Step 2 Write an equation. d = 80 – 3t
2 2 2 –80 t = = 26 3 3 3 –3 t-intercept: 26 Janet will reach the shore after seconds. 26 Notes Step 3 Find the intercepts and graph the equation. d-intercept:80 Solve for t when d = 0 d = 80 – 3t 0 = 80 – 3t
Example 3A Continued Revenues 21,000 22,400, 23,400 24,000 First differences 1,400 1,000 600 Second differences 400 400 Because the second differences are constant, a quadratic model is appropriate. Use a graphing calculator to perform a quadratic regression on the data.
Review 4B. An online computer game company has 10,000 subscribers paying $8 per month. Their research shows that for every 25-cent reduction in their fee, they will attract another 500 users. Use a table and an equation (linear, quadratic or exponential) to find the fee that the company should charge to maximize their revenue.