Download
1 / 17
170 likes | 193 Views
Explore how the graph of a function changes as the x-coordinate approaches a constant or a function, and analyze vertical asymptotes, horizontal asymptotes, holes, and intercepts.

E N D
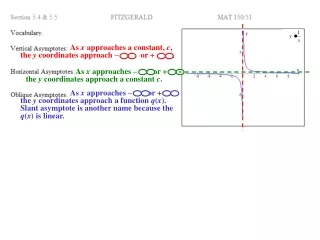
As x approaches a constant, c, the y coordinates approach – or + . As x approaches – or + the y coordinates approach a constant c. As x approaches – or + the y coordinates approach a function q(x). Slant asymptote is another name because the q(x) is linear.
Translate Graph The plus 3 is on the outside, so add 3 to each y coordinate. Also move the horizontal asymptote y = 0 to y = 3. x = 0 y = 3 y = 0
Translate Graph The minus 2 is on the inside, so add 2 to each x coordinate. Also move the vertical asymptote x = 0 to x = 2. x = 0 x = 2 y = 0
Translate Graph The power of 2 will mean that there will be no negative y coordinates and the y coordinates will increase faster, when 0 < x <1, and decrease faster, when x > 1. x = 0 y = 0
Translate Graph x = 0 The negative will flip the graph over the x-axis and the plus 2 will shift it up 2 units. y = 2 y = 0
Translate Graph x = 0 We will just shift the previous example down 2. y = 0 y = -2
Translate Manipulate the function until you have the original function somewhere in the new function. Graph x = 0 y = 1 y = 0 The negative 9 will flip over the x-axis (multiply the y coordinates by -9) and shift up 1 unit. We will introduce a new set of points when x = 3 and -3. This will cancel the -9 to -1.
FACTOR THE NUMERATOR & DENOMINATOR. We will work with both forms of R(x). Set the factors in the DENOMINATOR equal to zero and solve for x. This will be the equations of the Vertical Asymptotes. Compare the leading terms of N(x) and D(x). CASE 1. n < m : The degree of the N(x) is less than the degree of the D(x). The HORIZONTAL ASYMPTOTE is y = 0. CASE 2. n = m : The degree of the N(x) is equal to the degree of the D(x). The HORIZONTAL ASYMPTOTE is y = a/b . CASE 3. n > m : The degree of the N(x) is greater than the degree of the D(x). NO HORIZONTAL ASYMPTOTE. Need to find OBLIQUE ASYMPTOTE.
Set the factors in the NUMERATOR equal to zero and solve for x. This will be the x-intercepts in the form ( __ , 0 ). The y-intercept is ( 0, c/d ) Graph with an open circle on the x-axis. Graph with a closed circle on the x-axis. Mainly the RHB because it is the same for even and odd powers. Divide the leading coefficients’ signs for the sign of the RHB Holes occur when there is a binomial factor that is the same in both the top and bottom. This will eliminate a vertical asymptote and an x–intercept. Example. The Hole is located at ( 3, R(3) ) after you cancel the binomials. x = 3 is needed to find the hole.
H.A. and y-intercept are the easiest to find before factoring. 1 FACTOR 3. x = -2 x = 1 + + 1. Case 1. y = 0 -2 0 1 3 4. x = 3; ( 3, 0 ) Graphing Order. 2. ( 0, -3/-2 ) = ( 0, 3/2 ) 1. V.A. & x-intercepts. 2. Positive & Negative regions. RHB 3. H.A. & y-intercepts.
H.A. and y-intercept are the easiest to find before factoring. 1 FACTOR 1 + 0 3. x = 0 x = -3 1 + + + 1. Case 2. y = 1 0 -3 -2 2 4. x = 2, -2; ( 2, 0 ), ( -2, 0 ) Graphing Order. 2. ( 0, -4/0 ) = undefined NO Y-INTERCEPT 1. V.A. & x-intercepts. 2. Positive & Negative regions. RHB 3. H.A. & y-intercepts.
FACTOR 1 6 x = 1 3. Case 3. No H.A., Oblique Asymptote + + 1. 1 -1 -6 -2 1 3 1 X 4. 1 1 0 X No remainder in Oblique Asymptotes x = 3; ( 3, 0 ) y = x x = -2; ( -2, 0 ) Graphing Order. 2. ( 0, -6/-1 ) = ( 0, 6 ) 1. V.A. & x-intercepts. 2. Positive & Negative regions. RHB 3. O.A. & y-intercepts.
H.A. and y-intercept are the easiest to find before factoring. FACTOR We have a HOLE at (-3, __). Find R(-3). 3. x = 2 1. Case 2. y = 1 y = 1 + + -3 2 3 4. x = 3; ( 3, 0 ) Graphing Order. 2. 1. V.A. & x-intercepts. ( 0, -9/-6 ) = ( 0, 3/2 ) 2. Positive & Negative regions. RHB 3. H.A. & y-intercepts. 4. Graph the HOLE
x = 4 x = 0 What does the x-int. tell us? Draw in all asymptotes, intercepts, and label them. The factor on the top. What does the Vertical Asymptotes tell us? The factors on the bottom. What does the Horizontal Asymptote tell us? y = 0 ( 2, 0 ) The top degree is less than the bottom degree. Case 1
x = -2 Draw in all asymptotes, intercepts, and label them. What does the x-int. tell us? The factors on the top. What does the Horizontal Asymptote tell us? What does the Vertical Asymptotes tell us? The top degree is equal to the bottom degree. Case 2 The factors on the bottom. y = 2 ( 0, 0 ) ( -4, 0 ) The HA is y = 2. This means the leading coefficient ratio is 2 2 1 2 Both sides of the V.A. are going down…multiplicity of 2.
Draw in all asymptotes, intercepts, HOLES, and label them. x = 2 What does the x-int. tell us? The factors on the top. What does the Vertical Asymptotes tell us? ( 0, 1.5 ) The factors on the bottom. ( -2, 1.25 ) ( -2, ? ) y = 1 What does the Horizontal Asymptote tell us? ( 3, 0 ) What does the HOLE tell us? Repeat factors on the top and the bottom. The top degree is equal to the bottom degree. Case 2 We can find y-coord. of the HOLE. We can verifythe y-int.
x = -1 Label all asymptotes, intercepts, and multiplicity. (2) 2 What does the x-int. tell us? The factors on the top. What does the Horizontal Asymptote tell us? What does the Vertical Asymptotes tell us? The top degree is equal to the bottom degree. Case 2 The factors on the bottom. y = 1 ( 0, 0. ? ) ( 0, 0.75 ) ( 1, 0 ) ( 3, 0 ) We can verifythe y-int. TIME OUT! Y-int is POSITIVE. x = 2 (2) 2